


Larry William's Ultimate Oscillator
Coding William's Ultimate Oscillator in Python

Larry Williams developed an indicator that he called the ultimate oscillator which relies on a combination of buying pressure, true range, and moving averages. The idea of the indicator is to find oversold and overbought zones from where reactions are possible. In this indicator, we will code the ultimate oscillator in Python.
I have released a new book after the success of my previous one “Trend Following Strategies in Python”. It features advanced contrarian indicators and strategies with a GitHub page dedicated to the continuously updated code. If you feel that this interests you, feel free to visit the below Amazon link (which contains a sample), or if you prefer to buy the PDF version, you could check the link at the end of the article.
Contrarian Trading Strategies in Python
Amazon.com: Contrarian Trading Strategies in Python: 9798434008075: Kaabar, Sofien: Bookswww.amazon.com
The Concept of Moving Averages
Moving averages come in all shapes and types. The most basic type is the simple moving average which is simply the sum divided by the quantity. The next mathematical representation shows how to calculate a simple mean given a dataset:

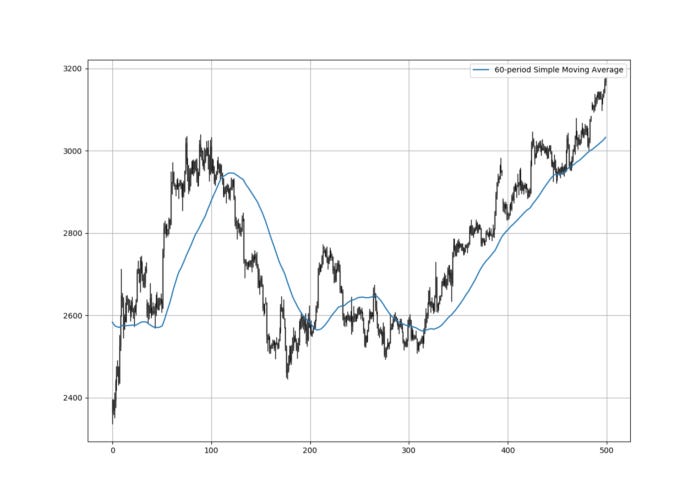
Therefore, the simple moving average is the sum of the values divided by their number. In technical analysis, you generally use moving averages to understand the underlying trend and to find trading signals.
Check the next Figure which shows a 60-period simple moving average applied on hourly values of Ethereum versus USD.
Make sure to focus on the concepts and not the code. You can find the codes of most of my strategies in my books. The most important thing is to comprehend the techniques and strategies.
If you are also interested by trend following strategies and indicators, then my previous book might interest you:
Trend Following Strategies in Python: How to Use Indicators to Follow the Trend.
Amazon.com: Trend Following Strategies in Python: How to Use Indicators to Follow the Trend.: 9798756939620: Kaabar…www.amazon.com
Constructing the Ultimate Oscillator
The creator of the oscillator had the goal of detecting outstretched momentum movements across different lookback periods. This is in turn lessens the excess volatility caused by the lower lookback periods. To construct the ultimate oscillator, we will follow these steps before presenting them in more detail right below:
Select the lookback periods of the three moving averages we will use. The default periods set by the creator of the Oscillator are 7, 14, and 28.
Calculate the Buying Pressure for each period.
Calculate the True Range for each period.
Divide the Buying Pressure by the True Range for each period.
Calculate the simple moving average of the previous result three times using the three different periods.
Calculate a weighted average of the three simple moving averages and multiply by 100.
Let us get started with the definition of buying pressure. It is a simple formula as shown below:

Next step is to calculate the true range, a measure for historical volatility. It uses the below formula:

The moving averages used will be of the simple type. Here is what we will do:
Calculate the 5-period simple moving average of BP/TR.
Calculate the 13-period simple moving average of BP/TR.
Calculate the 21-period simple moving average of BP/TR.
And finally, we are ready to apply the below formula to calculate the ultimate oscillator:
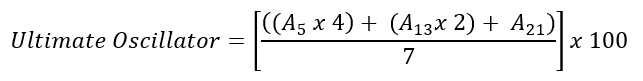
Giving us the below full Python code for the ultimate oscillator:
def ultimate_oscillator(data, high, low, close, where): data = add_column(data, 7) # Buying pressure
for i in range(len(data)):
data[i, where] = data[i, close] - min(data[i, low], data[i - 1, close])
# True range
for i in range(len(data)):
data[i, where + 1] = max(data[i, high], data[i - 1, close]) - min(data[i, low], data[i - 1, close])
if data[i, where + 1] == 0:
data[i, where + 1] = 0.01
# BP / TR
data[:, where + 2] = data[:, where] / data[:, where + 1]
# A5
data = ma(data, 5, where + 2, where + 3)
# A13
data = ma(data, 13, where + 2, where + 4)
# A21
data = ma(data, 21, where + 2, where + 5)
# Ultimate Oscillator
for i in range(len(data)):
data[i, where + 6] = (data[i, where + 3] * 4) + (data[i, where + 4] * 2) + (data[i, where + 5])
data[i, where + 6] = (data[i, where + 6] / 7) * 100
data = delete_column(data, where, 6)
return data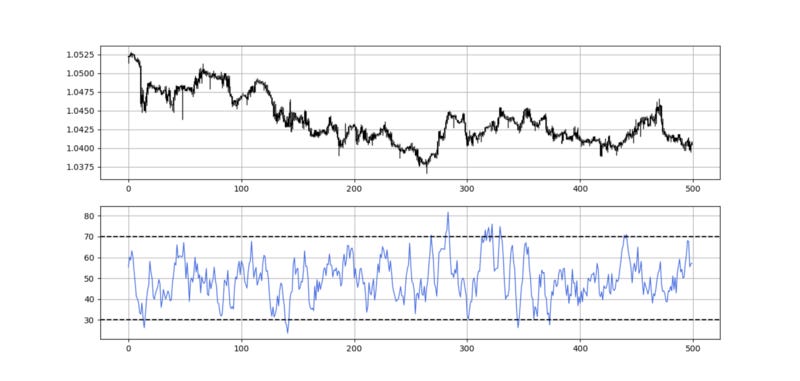
The creator had intended the oscillator to be used with divergences.

Personal Critique
In my opinion, I see no added-value from this oscillator for the following reasons:
The back-testing results show no positive expectancy whatsoever which argues that the predictive nature of the oscillator is absent.
The oscillator uses random numbers as lookback periods and weights in an attempt to apply them on the totality of markets which is a courageous thing to do knowing that every market is statistically different.
The divergence strategy is stated as the best one to be used on this oscillator but the back-testing results also fail to impress. Also, some markets suffer from a lack of signals.
The oscillator is not that heavily followed by traders which possibly hinders its impact on the markets. In contrast, an indicator like the RSI is likely to have a bigger impact since it is the most known technical indicator.
Summary
To summarize up, what I am trying to do is to simply contribute to the world of objective technical analysis which is promoting more transparent techniques and strategies that need to be back-tested before being implemented. This way, technical analysis will get rid of the bad reputation of being a subjective and scientifically unfounded.
I recommend you always follow the the below steps whenever you come across a trading technique or strategy:
Have a critical mindset and get rid of any emotions.
Back-test it using real life simulation and conditions.
If you find potential, try optimizing it and running a forward test.
Always include transaction costs and any slippage simulation in your tests.
Always include risk management and position sizing in your tests.
Finally, even after making sure of the above, stay careful and monitor the strategy because market dynamics may shift and make the strategy unprofitable.
For the PDF alternative, the price of the book is 9.99 EUR. Please include your email in the note before paying so that you receive it on the right address. Also, once you receive it, make sure to download it through google drive.
Pay Kaabar using PayPal.Me
If you accept cookies, we’ll use them to improve and customize your experience and enable our partners to show you…www.paypal.com