


Ichimoku Kinko Hyo Stripped
It's Not as Cloudy as it Seems


Ichimoku Kinko Hyo is a complex technical indicator requiring some getting-used-to before mastering it. This article tries to tweak it a little bit into a contrarian indicator.
Ichimoku Kinko Hyo in a Nutshell
Ichimoku Kinko Hyo, often shortened to just Ichimoku, is a comprehensive technical analysis indicator that provides a full picture of market trends, momentum, and potential support/resistance levels — all in one view.
Developed by Goichi Hosoda, a Japanese journalist, in the late 1930s and popularized in the 1960s, its name roughly translates to "one glance equilibrium chart," which reflects its core idea: traders should be able to assess the market at a glance.
Ichimoku consists of five lines:
Tenkan-sen (Conversion Line).
Kijun-sen (Base Line).
Senkou span A.
Senkou span B.
Chikou Span.
The Tenkan-sen and Kijun-sen are short- and medium-term averages (calculated using midpoints of highs and lows), and their crossovers can signal potential buy or sell points. The Senkou span A and B form the Kumo (cloud), which projects future support and resistance areas — the cloud’s thickness suggests market volatility, and whether price is above or below the cloud indicates bullish or bearish momentum. The Chikou Span, a lagging line that plots the current closing price shifted backward, helps confirm the strength of a trend.
What makes Ichimoku unique is its forward-looking nature — especially the cloud, which extends into the future and helps anticipate key levels before price reaches them. However, the system works best in trending markets and can be overwhelming due to its complexity. It's often used in combination with other tools or price action strategies for confirmation. Despite its visual clutter, once understood, Ichimoku offers a layered, balanced view of the market’s structure, making it a favorite among swing traders and long-term analysts.

Check out my newsletter that sends weekly directional views every weekend to highlight the important trading opportunities using a mix between sentiment analysis (COT report, put-call ratio, etc.) and rules-based technical analysis.

Focusing on the Lines
For the indicator, we will take the difference between the Tenkan-sen and the Kijun-sen. This technique is a type of MACD. The following shows the result of this differencing.
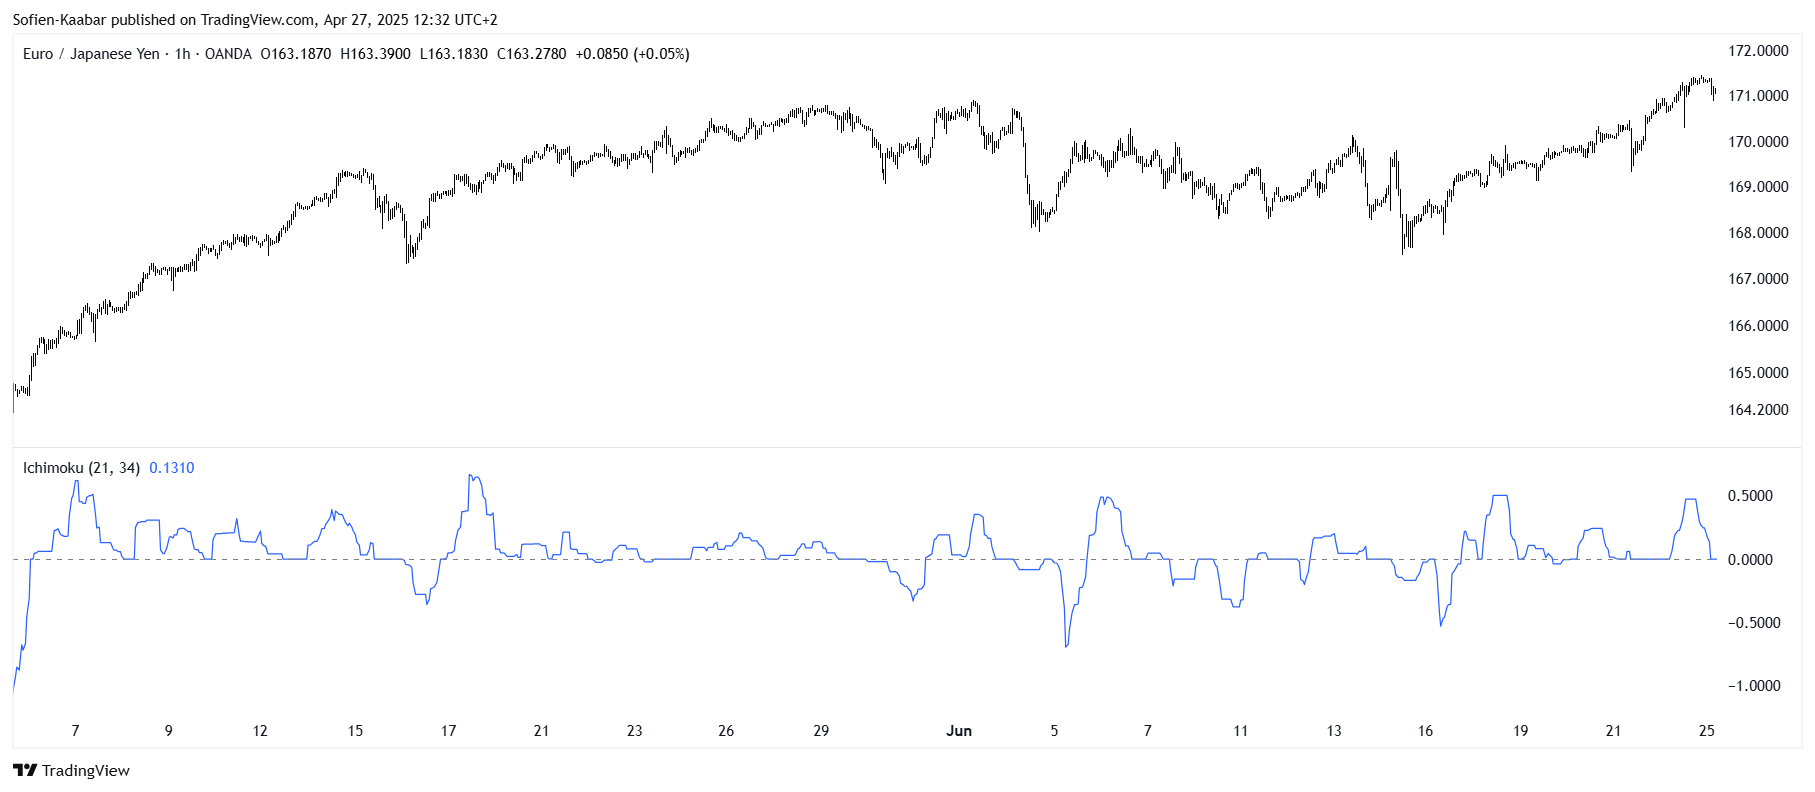
Subjective support and resistance levels can then be inferred from the indicator above in order to detect reversals.
//@version=6
indicator(title="Ichimoku Cloud", shorttitle="Ichimoku", overlay=false)
conversionPeriods = input.int(21, minval=1, title="Conversion Line Length")
basePeriods = input.int(34, minval=1, title="Base Line Length")
donchian(len) => math.avg(ta.lowest(len), ta.highest(len))
conversionLine = donchian(conversionPeriods)
baseLine = donchian(basePeriods)
plot(conversionLine - baseLine)
hline(0)
Something else you can try out is the divergence technique. In simple words, divergence can be described as follows:
The price is moving one way, but the indicator is "pulling" in another direction, warning you that the current price trend might be getting weak or about to reverse.

🔥Deep Learning for Finance! Master the future of financial modeling with fractional differentiation, LSTM forecasting, multi-period predictions, and machine learning for time series. A must-read for serious quants and traders.