

For years, I’ve been building tools to answer a simple question: where is the edge in markets, really? Not opinions, not narratives, not hindsight explanations, but measurable, testable signals.
What started as a personal research framework has evolved into something much bigger. Today, I’m launching it.
In a Nutshell, What is Quant Atlas?
Quant Atlas is a forecasting platform that delivers directional market views through a set of independent quantitative models.
At its core, it answers a simple question: what is the market most likely to do next, and how strong is that view? Each forecast is driven by one of the specialized models, all independent and designed to capture a different dimension of market behavior:
Cerberus: the core price forecasting engine,
Echo: volatility forecasting,
Vision: smart composite bullish and bearish signal engine,
Freyja: pattern recognition across equities,
Yubel: trend exhaustion detection,
Helios: macro and cross-asset tools,

The platform operates across two time horizons:
A weekly layer that provides forecasts for the upcoming week (through daily bars).
An intraday layer that provides forecasts for the current day (throuh hourly bars).
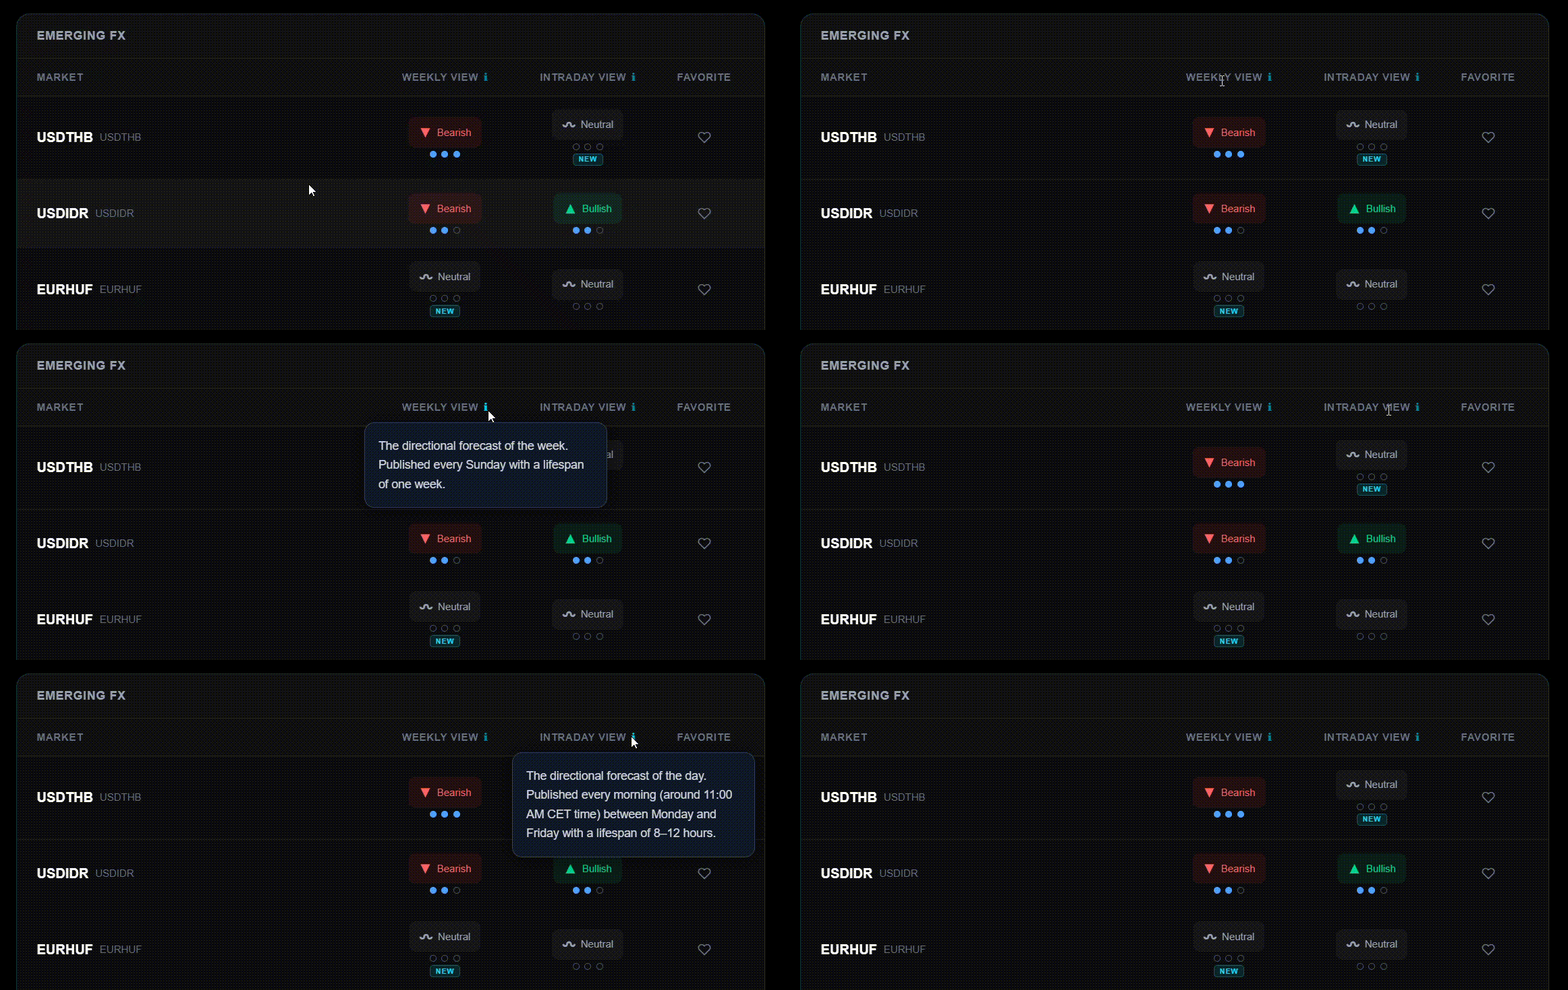
Rather than forcing a single narrative, Quant Atlas surfaces multiple perspectives. These views can align or diverge, forming a measurable consensus that reflects conviction.
To cut through the noise, a Spotlight report highlights the strongest opportunities so you don’t have to scan every chart to find the edge.
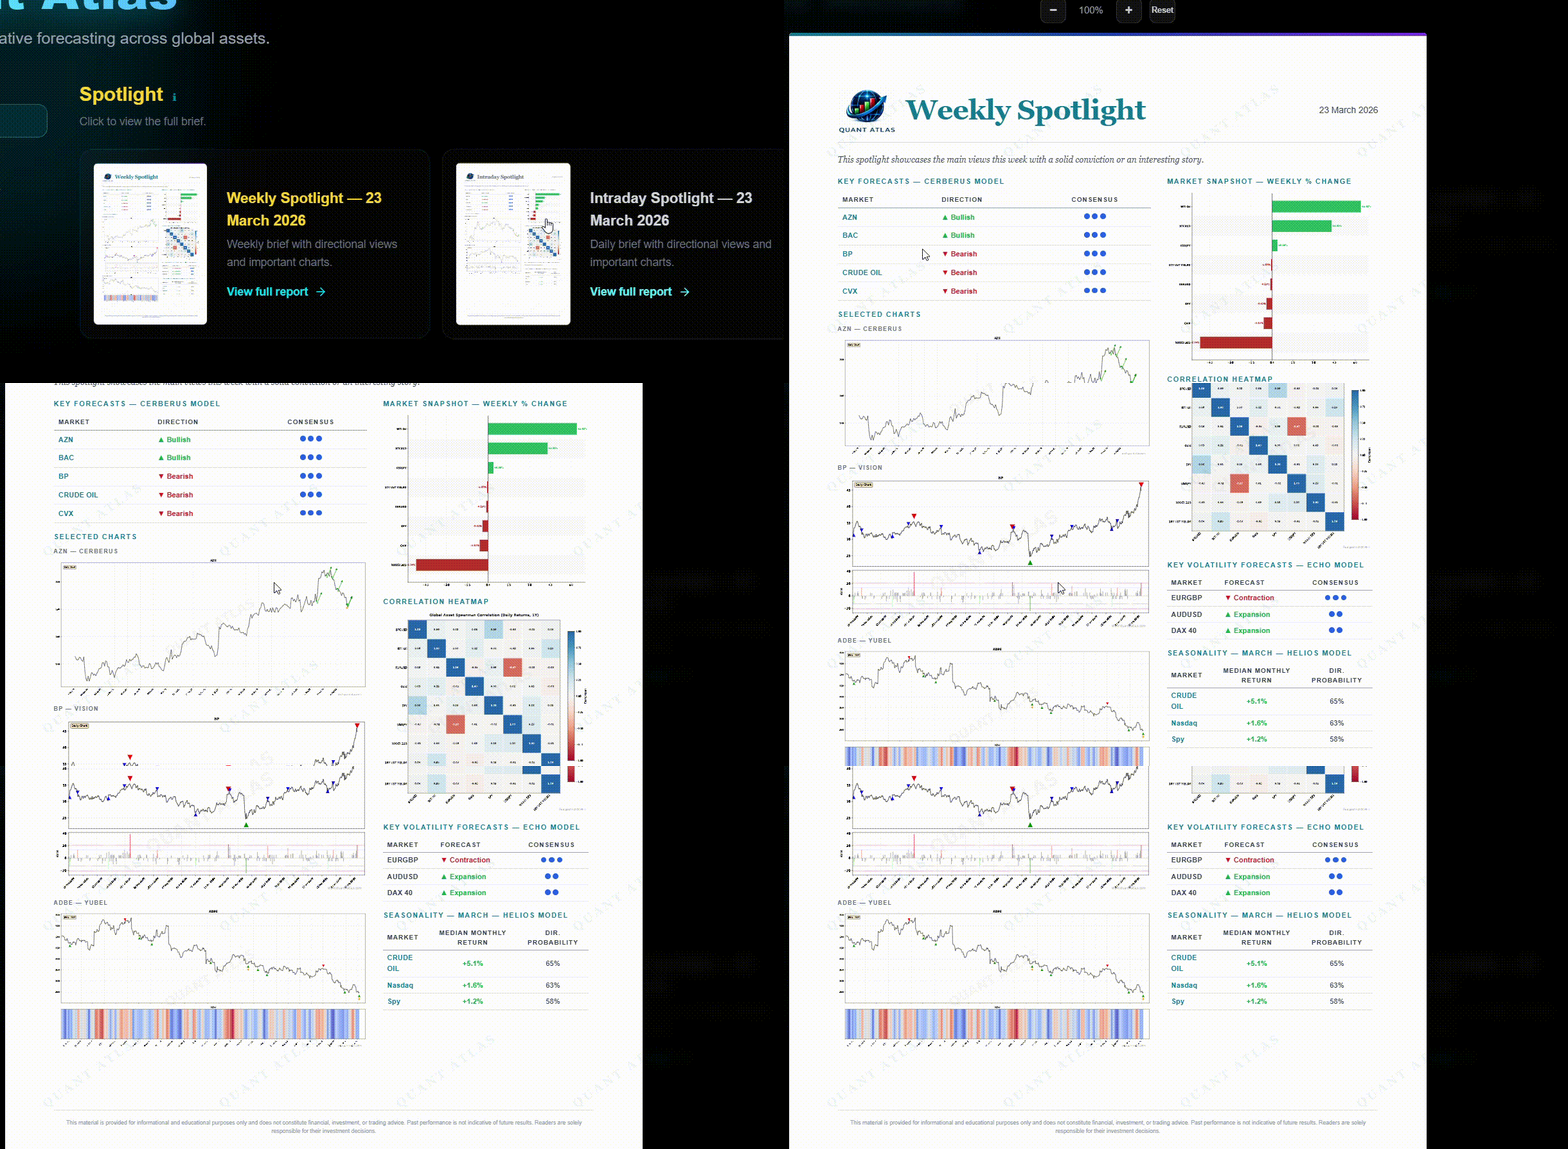
Markets can be filtered by conviction or asset class, and users can track their own universe through a favorites system.

Quant Atlas comes with a 3-week Free trial.
No commitments, no assumptions, just access to the full platform so you can see how the models behave in real market conditions.
The goal isn’t to convince you with words. It’s to let the data speak.
Watch the forecasts play out. Track the conviction. See how the models behave across different markets and timeframes.
If there’s real value, it will be obvious.
Access is intentionally capped so the platform can remain a focused research environment rather than a crowded signal service. Access will be closed after the first 100 users.
The platform is designed for institutional and retail traders (quantitative and discretionary), portfolio managers, research analysts, and anyone interested in having market forecasts based on evidence-based models that are proven by solid statistical methods.
What You Can Also Find on the Website
The website doesn’t just contain access to Quant Atlas, it also has all my other educational material, all centralized in one place.
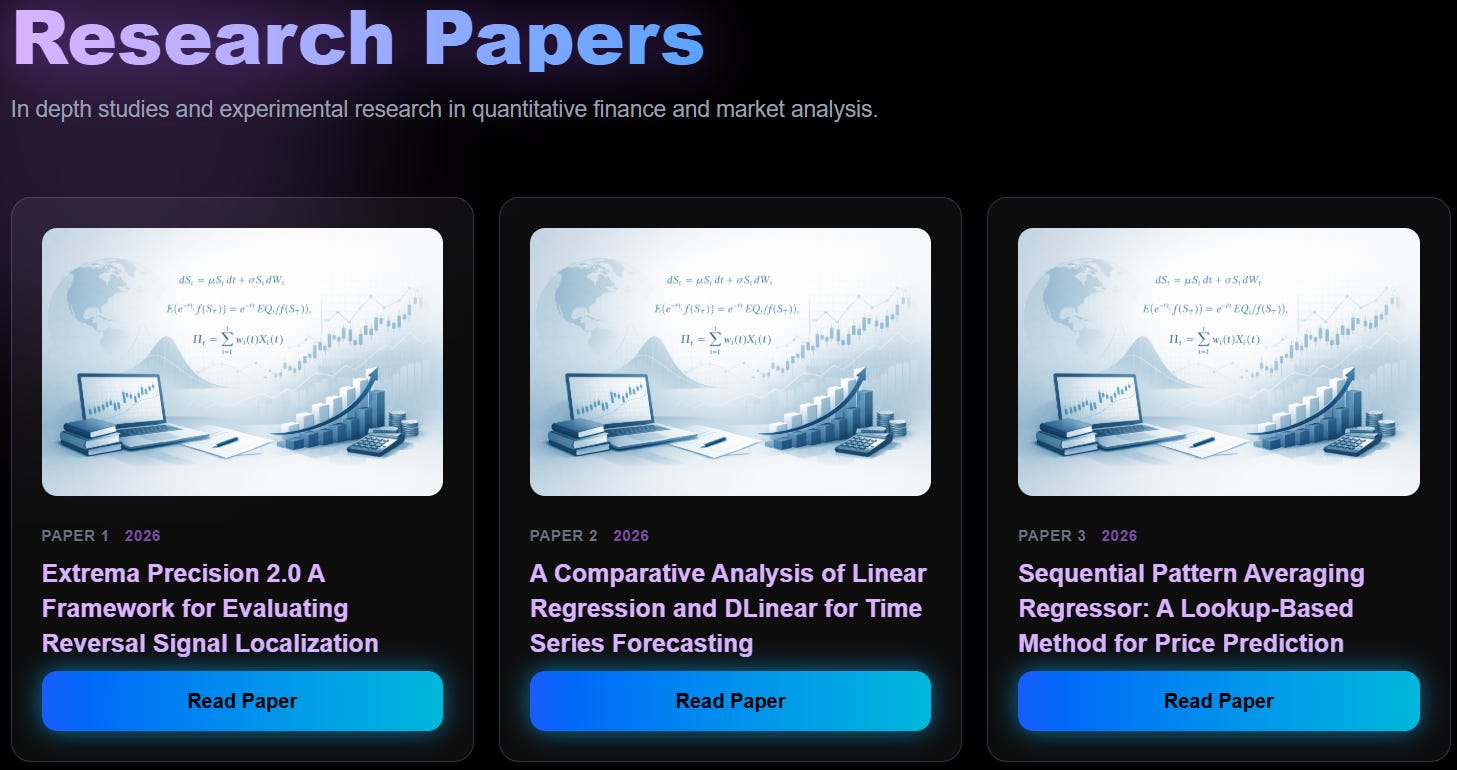
🔬 Research Papers
A collection of original research exploring trading models, market behavior, and data-driven strategies, with a focus on building measurable edge. You can read them on the website or download them.
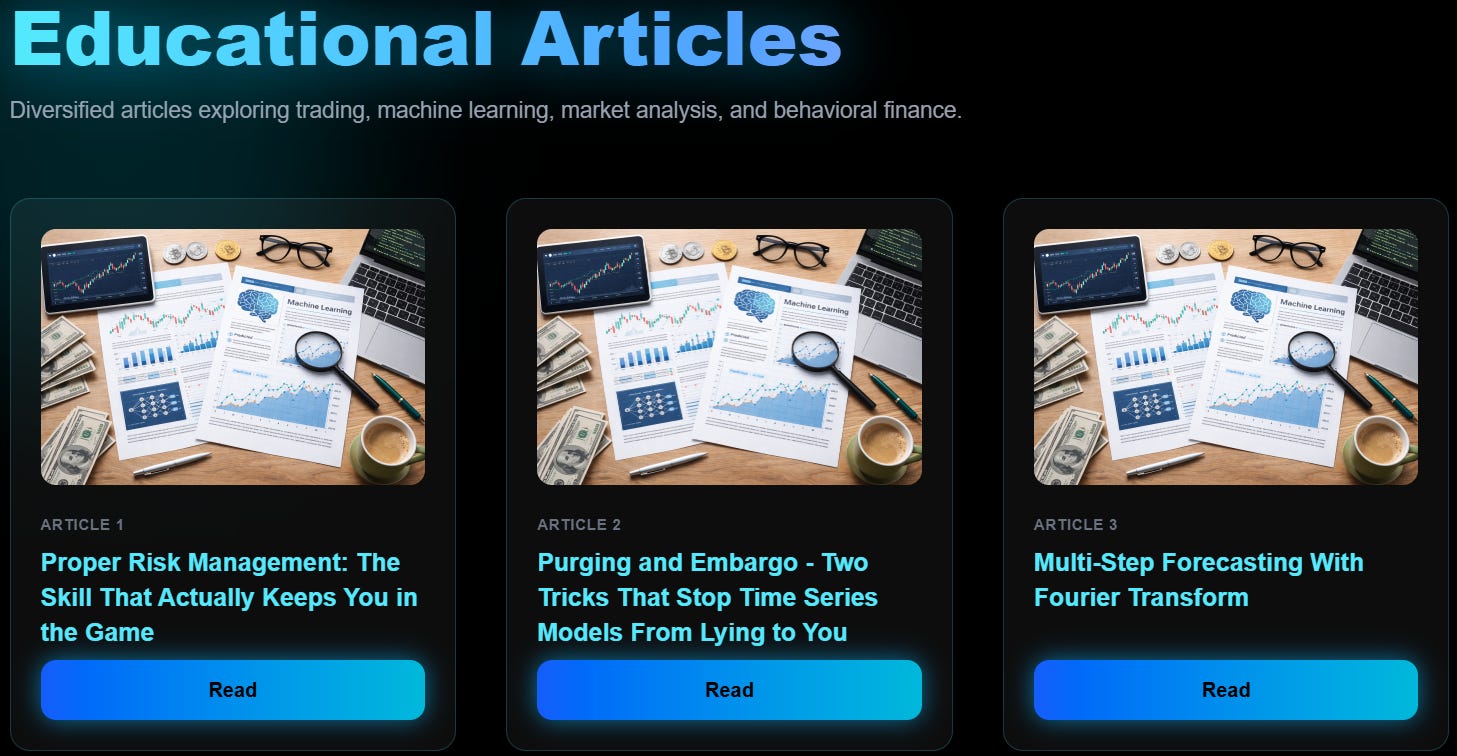
📝 Educational Articles
A collection of educational articles where I break down markets, trading concepts, and model-driven insights in a clear, practical way. You can read them on the website or download them.
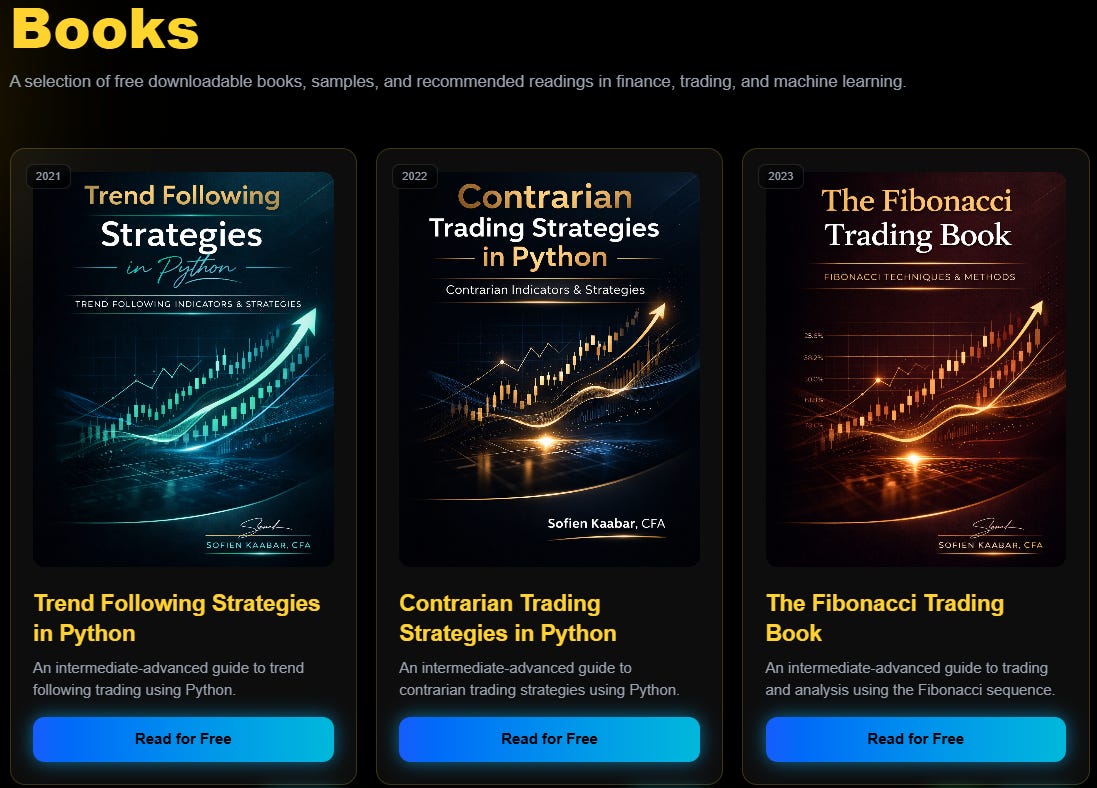
📖 Books
A curated collection of books that shaped my approach to markets, trading, and decision-making. No fluff, just high-value reads worth your time. You can read them on the website or download them (no signup or login required).
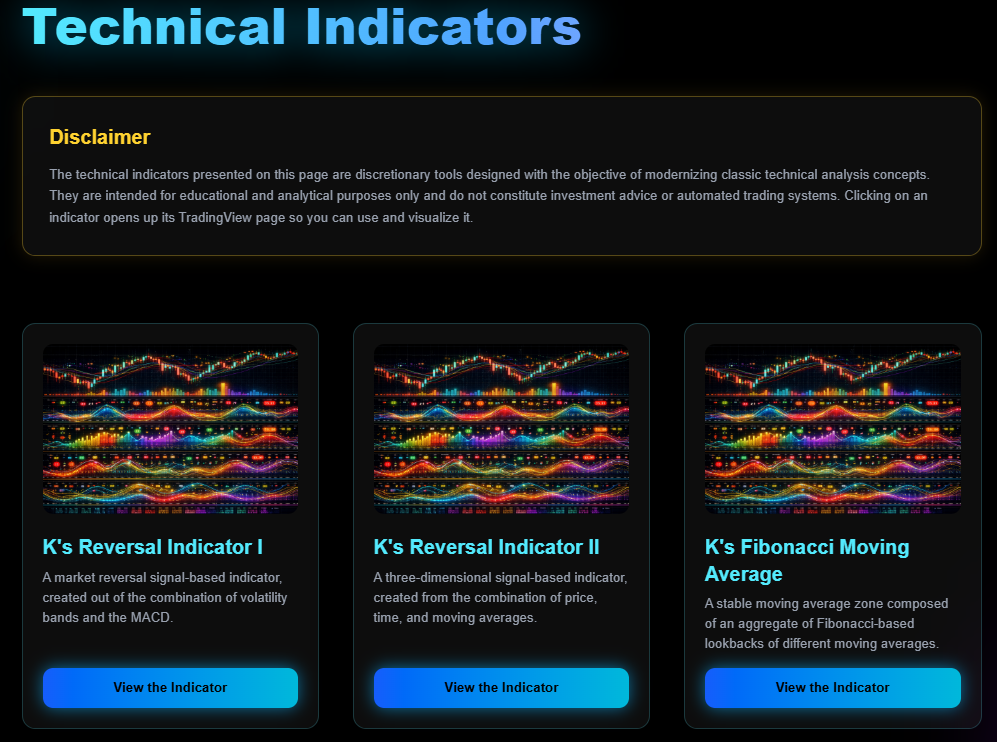
🔦 Technical Indicators
A dedicated section featuring my core technical indicators, built to highlight momentum, market structure, and key entry zones. Each tool is designed to cut deliver practical signals. Just like any other technical indicator, they have their limitations.
Last Words
I am very excited to share with you the fruits of my years of working and researching. If you have any questions, you can use the Contact form on the website or contact me on LinkedIn.
Disclaimer: I use these forecasts for my own investments as well. I typically give greater weight to high consensus views.
Congratulations on this huge accomplishment, Sofien! Thank you for your tremendous research, publications, and hard work. Quant Atlas is an amazing value.