Psychological levels are round levels that are likely to have more reaction around them than other levels. This article discusses the creation of a psychological scanner in TradingView.
The Intuition of Psychological Levels
Psychological levels form an important part in any analysis. The reason for this is because mentally, they are given more attention than other levels. For instance, which price would you retain more in your mind if you come across it? 1.1500 on the EURUSD or 1.3279 on the GBPUSD? By psychological Levels, we are talking about either round numbers (such as 1.2000 on the EURUSD) or simply par numbers (such as 1.000 USDCHF or $100 on Apple stock).
Clearly, round numbers are the first part of a psychological price. The other part is simply significance. For example, the par-value or par-level such as 1.000 on the USDCHF or 100.00 on the USDJPY is considered a par-level. The basic idea is that around these levels, market participants may choose to place their orders, hence, a form of reaction may happen.
You can also check out my other newsletter The Weekly Market Sentiment Report that sends tactical directional views every weekend to highlight the important trading opportunities using a mix between sentiment analysis (COT reports, Put-Call ratio, Gamma exposure index, etc.) and technical analysis.
Creating the Strategy
Let’s code a strategy that scans FX pairs (that have four decimal points like EURUSD and USDCHF) and outputs signals based on a few conditions. The trading rules are as follows (later explained in the code):
Using the modulo technique, if the remainder is zero, then a psychological level has been detected. Furthermore, if the 14-period RSI is less than 50 and the current close price is bearish, then a bullish signal is generated.
Using the modulo technique, if the remainder is zero, then a psychological level has been detected. Furthermore, if the 14-period RSI is greater than 50 and the current close price is bullish, then a bullish signal is generated.
//@version=5
indicator("Psychological Levels", overlay = true)

price = math.round(close, 4)

is_round_price = (price * 1000) % 10 == 0

plotshape(is_round_price and ta.rsi(close, 14) < 50 and close < open, style = shape.triangleup, color = color.green, location =  location.belowbar, size = size.small)
plotshape(is_round_price and ta.rsi(close, 14) > 50 and close > open, style = shape.triangledown, color = color.red, location =  location.abovebar, size = size.small)
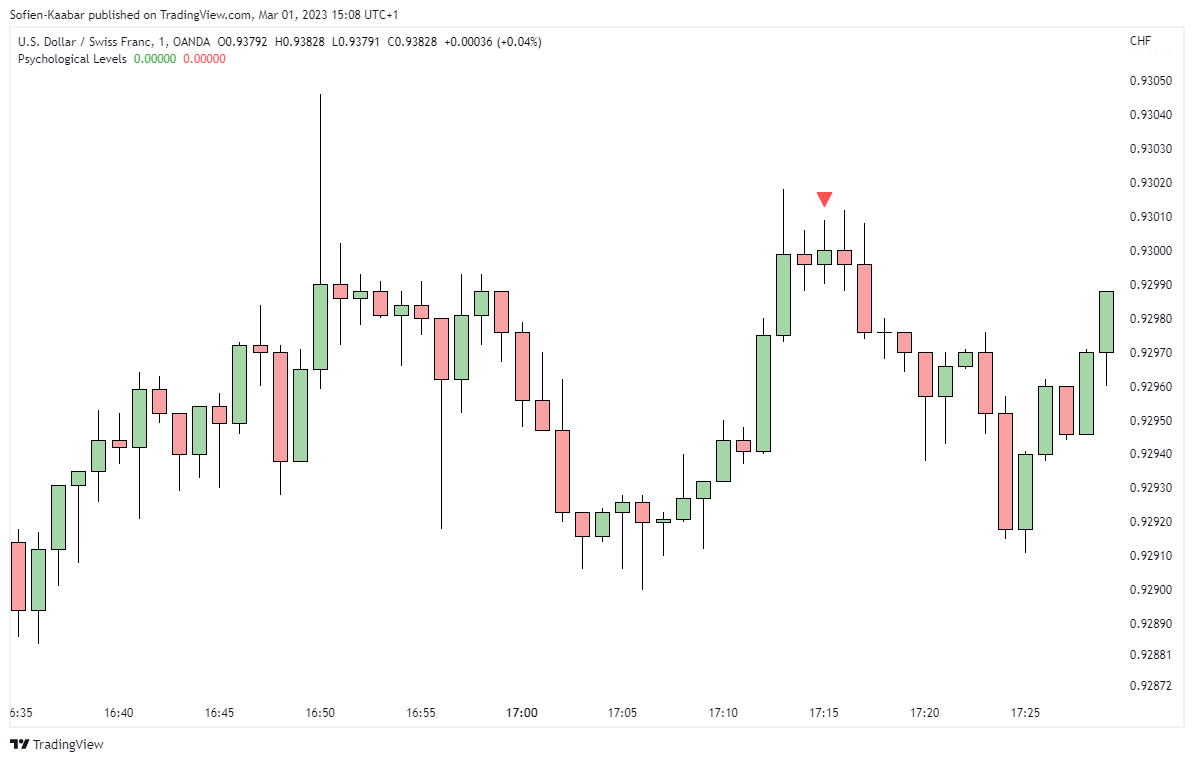
The following Figure shows a signal chart after applying the strategy.
Generally, different brokers and providers may have differences in quotations. This is the biggest flaw in the strategy.
You must not use this strategy as the protagonist of your trading system due to the flaw but it is always interesting to understand the market reaction around such psychological levels.
You can also check out my other newsletter The Weekly Market Analysis Report that sends tactical directional views every weekend to highlight the important trading opportunities using technical analysis that stem from modern indicators. The newsletter is free.
If you liked this article, do not hesitate to like and comment, to further the discussion!


