


How to Follow the Trend With this Powerful Strategy
Creating a Trading Strategy Using the SuperTrend and the Enveloped RSI


This article discusses a hybrid strategy using two exotic indicators that work in tandem to deliver a filtered trading signal.
The Fibonacci Trading Book is finally out! Filled with Fibonacci-based trading methods (tools, indicators, patterns, and strategies), this book will guide you through improving your trading and analysis by incorporating an important technical analysis approach that is Fibonacci. (Link to pay in PayPal for the PDF version at the end of the article)
The Main Components of the Strategy
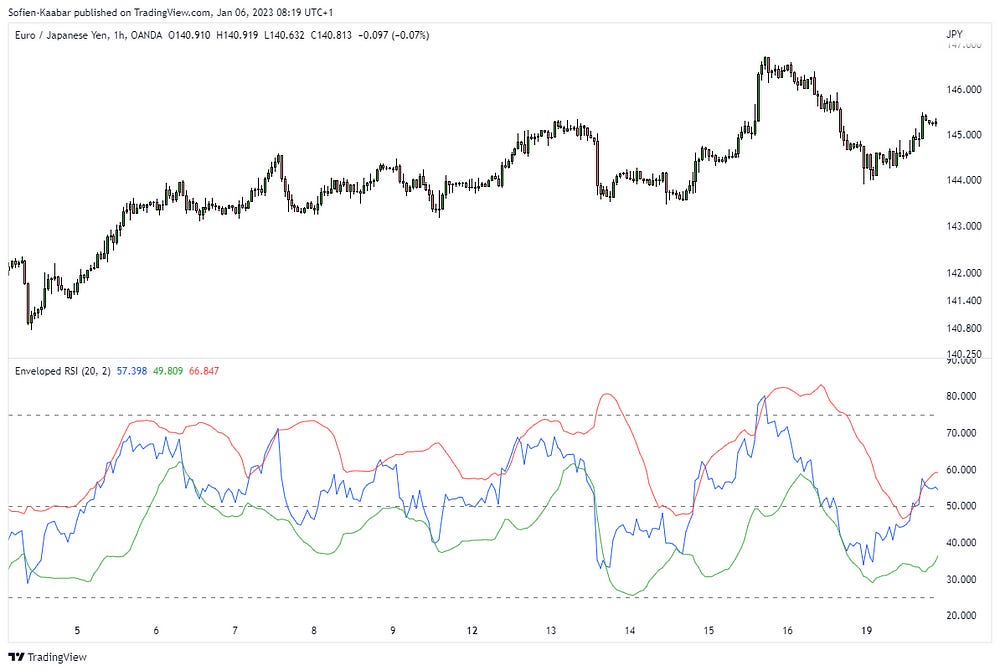
The strategy is composed of two indicators, the SuperTrend indicator, a new emerging way of following the trend using volatility measures and the enveloped RSI which is simply the well known RSI with volatility bands around it to give it objective barriers (support and resistance levels).
The enveloped RSI is as illustrated below a contrarian indicator where values close to the upper volatility band (in red) signal a bearish reversal in momentum while values close to the lower volatility band (in green) signal a bullish reversal in momentum.
The SuperTrend is a line that follows the price. Whenever it is below the market price, the implied trend is bullish and whenever it is above the market price, the implied trend is bearish.

Creating the Strategy
With the trend following characteristics of the SuperTrend and the contrarian abilities of the enveloped RSI, a trading strategy emerges, one that relies on the strengths of both indicators. Take a look at the next Figure that shows the signals of the strategy.
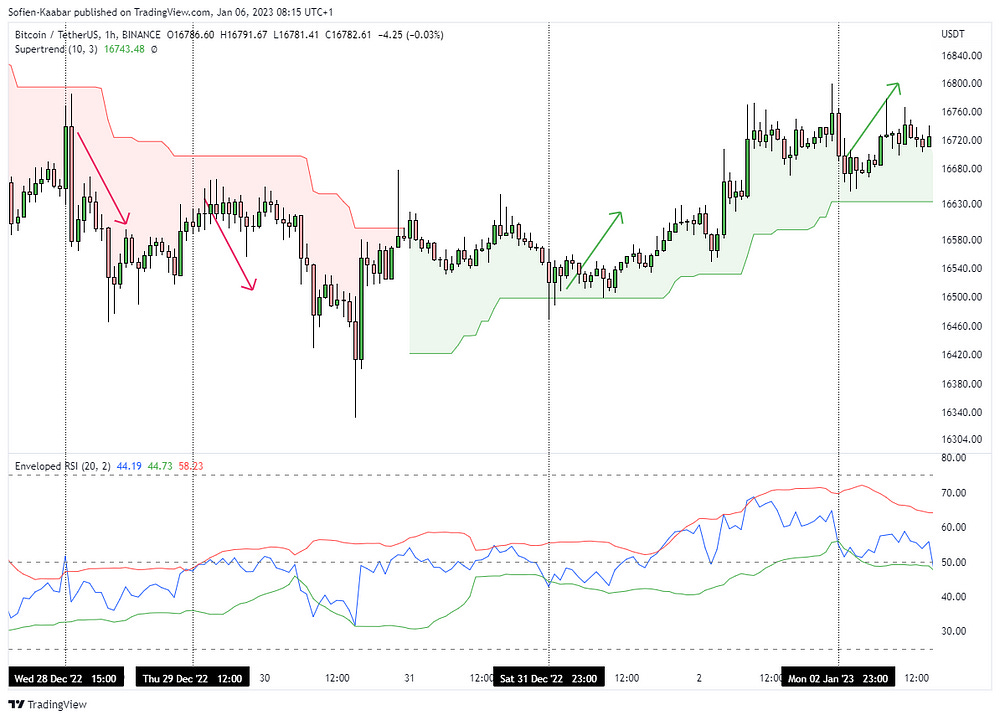
Obviously, the conditions of this strategy is to follow the trend given by the SuperTrend but only if there is a timing signal given by the enveloped RSI.
A long (buy) signal is generated whenever the market is above the SuperTrend line and the enveloped RSI is below or at its lower volatility band.
A short (sell) signal is generated whenever the market is below the SuperTrend line and the enveloped RSI is above or at its upper volatility band.
The following Figure shows an example of signals on EURUSD.

The following Figure shows an example of a bullish signal on the S&P 500 index.

If you want to see how to create all sorts of algorithms yourself, feel free to check out Lumiwealth. From algorithmic trading to blockchain and machine learning, they have hands-on detailed courses that I highly recommend.
Learn Algorithmic Trading with Python Lumiwealth
Learn how to create your own trading algorithms for stocks, options, crypto and more from the experts at Lumiwealth. Click to learn more