How Normalization Enhances Market Indicators
Transforming Raw Data into Actionable Market Insights
Technical indicators play a pivotal role in guiding traders’ decisions. This article introduces a novel technical indicator rooted in the concept of normalization, designed to enhance the precision and reliability of trading signals. Traditional indicators often struggle with data on varying scales, making it challenging to compare and analyze different time series effectively.
By leveraging normalization techniques, the proposed indicator ensures a consistent scale across different data sets, improving both the comparability and the interpretability of market signals.
The Concept of Normalization in Time Series
Normalization in time series involves transforming the data to ensure that it is on a consistent scale, which can help improve the performance of algorithms and the interpretability of results. It refers to adjusting the values in a time series to fit within a certain range or to have specific statistical properties.
The primary goal is to make different time series comparable or to improve the convergence and performance of machine learning models. We’ll just stick to the min-max scaling normalization function defined as follows:
This means that for a given time series, the function transforms all the values into a range [0, 1]. Take the following the example:
Notice how 50 (the biggest number) has a normalized value of 1 and 10 (the smallest number) has a normalized value of 0.
Normalization is a fundamental step in time series analysis and modeling. Choosing the appropriate normalization method depends on the specific characteristics of the data and the requirements of the analysis or model.
Let’s see how to apply this in technical analysis.
The Statistical Sentiment Index
The statistical sentiment index (SSI) takes eleven normalized functions of the close price with each having a lookback period corresponding to a Fibonacci number and then averages them.
After that, a smoothing of 8 periods is further applied on the result, which gives an oscillator between 0 and 100. The signals of the SSI are as follows:
A bullish signal is generated whenever the SSI surpasses 5 after having been below it.
A bearish signal is generated whenever the SSI breaks 95 after having been above it.
The way the SSI works is by trying to capture the corrections of extended trends. This is why it’s common to see its signals around the end of a long trend.
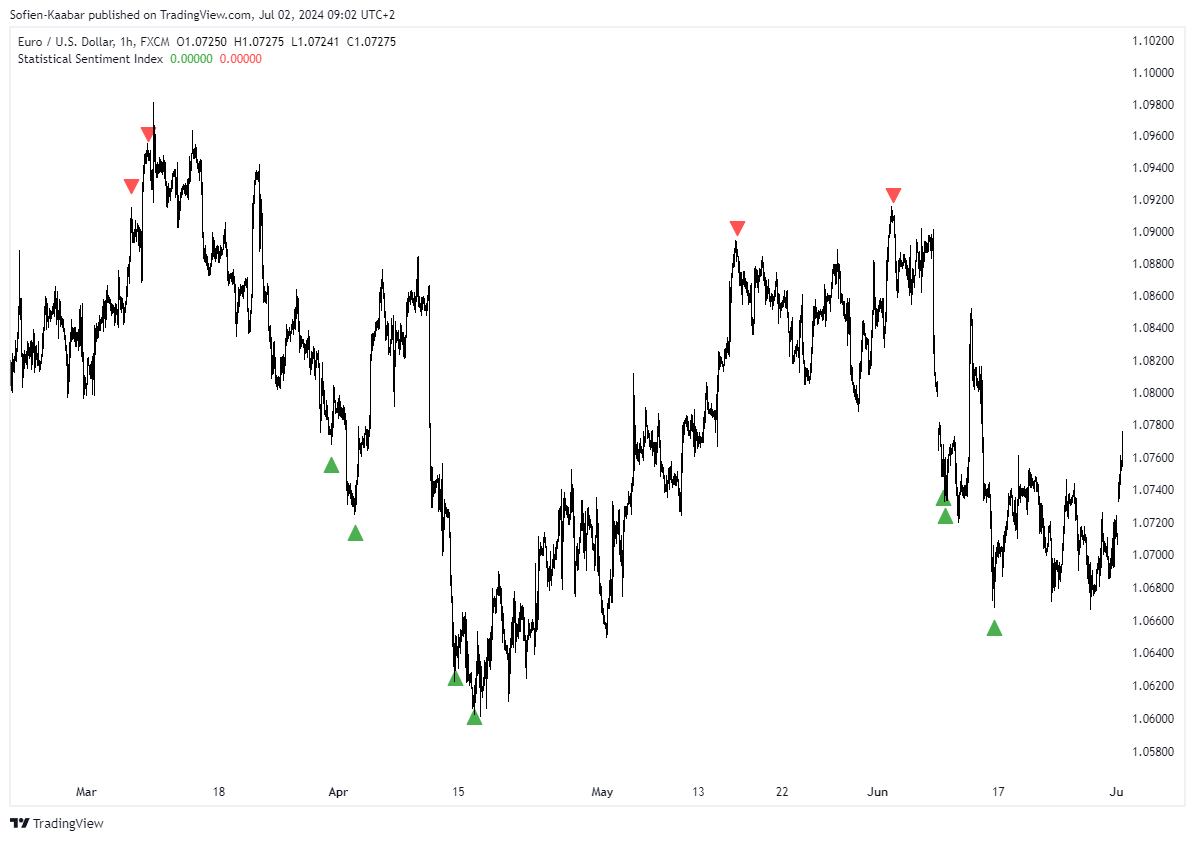
The following chart shows a few signals detected by the SSI:
Surely, with contrarian signals, the ideal market regime is a ranging (sideways) one. This means that with trending markets, the quality of signals decreases.
The following charts show a few signals detected during a trending environment:
To remedy this, consider taking the bullish signals in a bullish market and bearish signals in a bearish markets. They may be rare, but they have a better-than-average success probability.
To code the SSI in TradingView, you can use this code:
// This source code is subject to the terms of the Mozilla Public License 2.0 at https://mozilla.org/MPL/2.0/
// © Sofien-Kaabar

//@version=5
indicator("Statistical Sentiment Index", overlay = true)
norm_5 = ta.stoch(close, close, close, 5)
norm_8 = ta.stoch(close, close, close, 8)
norm_13 = ta.stoch(close, close, close, 13)
norm_21 = ta.stoch(close, close, close, 21)
norm_34 = ta.stoch(close, close, close, 34)
norm_55 = ta.stoch(close, close, close, 55)
norm_89 = ta.stoch(close, close, close, 89)
norm_144 = ta.stoch(close, close, close, 144)
norm_233 = ta.stoch(close, close, close, 233)
norm_377 = ta.stoch(close, close, close, 377)
norm_610 = ta.stoch(close, close, close, 610)
ssi_raw = (norm_5 + norm_8 + norm_13 + norm_21 + norm_34 + norm_55 + norm_89 + norm_144 + norm_233 + norm_377 + norm_610) / 11
ssi = ta.sma(ssi_raw, 8)
plotshape(ssi > 5 and ssi[1] < 5,  style = shape.triangleup, color = color.green, location =  location.belowbar, size = size.small)
plotshape(ssi < 95 and ssi[1] > 95,  style = shape.triangledown, color = color.red, location =  location.abovebar, size = size.small)
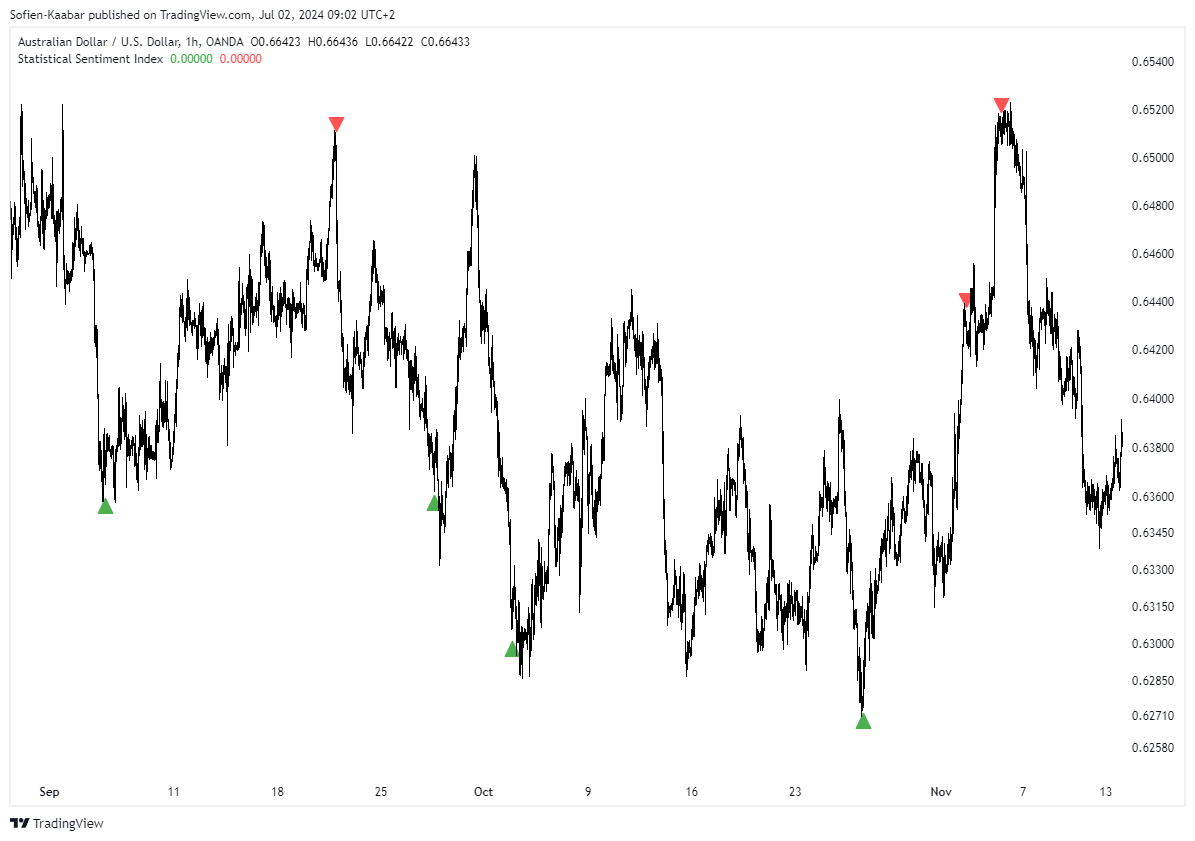
The following chart shows a few more signals detected by the SSI. Notice how during a stable environment, the indicator seems to deliver signals that hover around tops and bottoms.
In conclusion, the SSI is nothing but a simple add-on to any trading framework that must be based on a lot more than just a few indicators.
You can also check out my other newsletter The Weekly Market Sentiment Report that sends weekly directional views every weekend to highlight the important trading opportunities using a mix between sentiment analysis (COT report, put-call ratio, etc.) and rules-based technical analysis.
If you liked this article, do not hesitate to like and comment, to further the discussion!


