


Timing is one of technical analysis’ crucial elements. Basic indicators can be created to try to understand the duration of the market’s oversold or overbought levels. This article presents a way to find bullish signals using timing and the market’s lows.
Creating the Custom Timing Indicator
This will be a short discussion as the principle is very simple. We will create a condition that calculates the number of the lows that are lower than the lows two periods ago on a rolling basis. Then, whenever we see a flattening in that calculation, we can consider it to be a bullish signal. Let’s check out the code first.
//@version=6
indicator("Lower Low Count Oscillator", overlay=false)

// === INPUTS ===
length = input.int(14, "Lookback Period", minval=1)

// === LOGIC ===
// Count the number of times over 'length' bars where:
// current low is lower than the low two bars ago
counter = 0
for i = 0 to length - 1
    condition = low[i] < low[i + 2]
    counter += condition ? 1 : 0

// Normalize to 0–100 scale if desired
normalized = 100 * counter / length

// === PLOT ===
plot(counter, title="Lower Low Count", color=color.green, linewidth=2)
hline(12, "Max", color=color.red, linestyle=hline.style_dotted)
hline(0, "Min", color=color.gray, linestyle=hline.style_dotted)
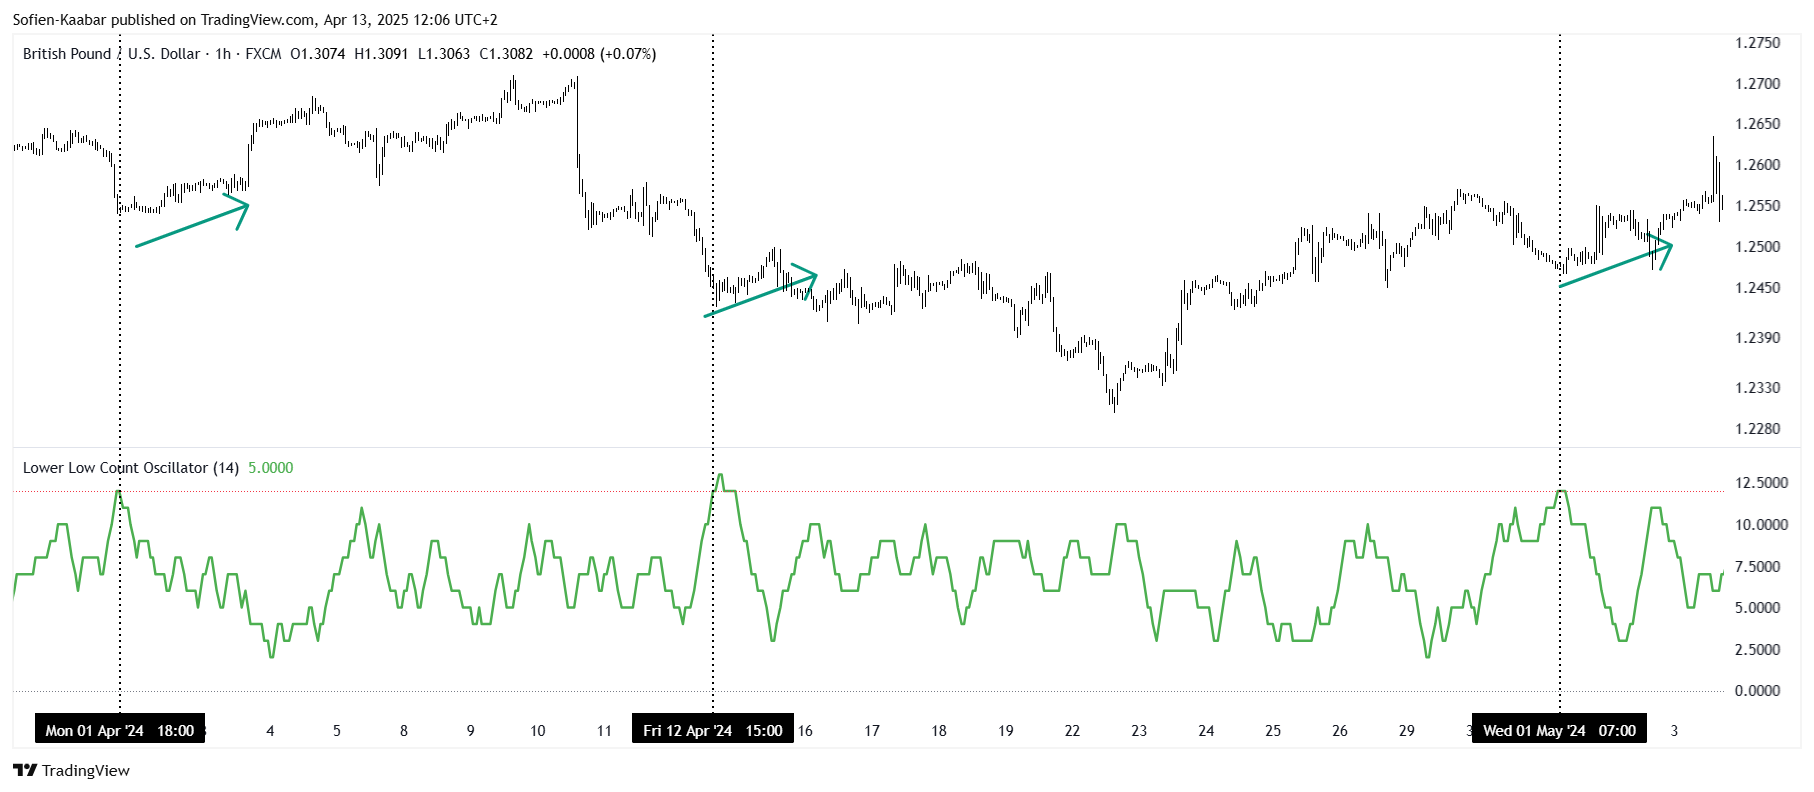
Therefore, whenever the indicator reaches high levels and flatten, there may be a bullish move to be expected. The following chart shows a few signals.
Check out my newsletter that sends weekly directional views every weekend to highlight the important trading opportunities using a mix between sentiment analysis (COT report, put-call ratio, etc.) and rules-based technical analysis.


This can be your building block towards a more complex timing indicator. For example, add the highs components, tweak the lookback period, add exogenous technical indicators.
This is some next-level thinking! Timing really is everything in the market. Excited to see how your indicator plays out!