


Financial markets can look chaotic from a distance. Prices move fast, narratives change by the hour, and opinions are everywhere. Over time, I learned that the only way to navigate that environment is to build a process.
That is the framework I use when I forecast markets and design trading strategies.
I begin by trying to understand the broader environment. My goal is simple:
reduce the chance of being blindsided, improve the quality of the setup, and take risk only when the conditions make sense.
This is also the philosophy behind Quant Atlas. The platform reflects the same thinking I use in my own market work: combine macro awareness, technical structure, sentiment, volatility, and disciplined risk management into a coherent decision making process.
1. I start from the macro picture
Before looking for entries, I want to know what kind of environment I am trading in.
Markets do not move in isolation. Currencies react to interest rate expectations. Equities reprice around growth and earnings. Bonds reflect inflation, policy direction, and changes in economic expectations. Commodities often respond to a mix of macro demand, supply constraints, and risk sentiment. If I ignore that background, I risk building a trade on a fragile foundation.
That is why I begin with a global macro perspective.
I look at interest rates, inflation metrics, policy expectations, and the broader economic backdrop. I want to know whether central banks are becoming more restrictive or more supportive. I want to know whether inflation is slowing, reaccelerating, or surprising relative to expectations. I want to understand whether markets are pricing optimism, slowdown, or stress.
This first layer does not give me an entry signal. It gives me context. It tells me what kind of market I may be dealing with and what themes are likely to matter most.
Let’s take an example from this first step: Interest rate differentials. I will create a rolling measure of interest rate differentials between two countries (e.g. USA and Japan) to understand the current picture. From it, I will move on to inflation, employment, and even PMI data.
A global scoring of these economic indicator will give me a macro long-term picture of which stock market will outperform the other one in the next few months.
2. Then I study the calendar(s)
Once the macro picture is clear enough, I move to the next layer: upcoming catalysts.
Even the best setup can be disrupted by a major economic release, a central bank speech, or an earnings report. That is why I pay close attention to both the economic calendar and the earnings calendar.
For macro sensitive markets, I monitor events such as inflation releases, labor data, GDP numbers, PMIs, and central bank decisions. For equities and indices, earnings matter just as much. Guidance revisions, margin pressure, revenue surprises, and management tone can reshape price action very quickly.
This step is essential because I do not want to take a position blindly right before an event that can materially change the market’s interpretation of value or risk.
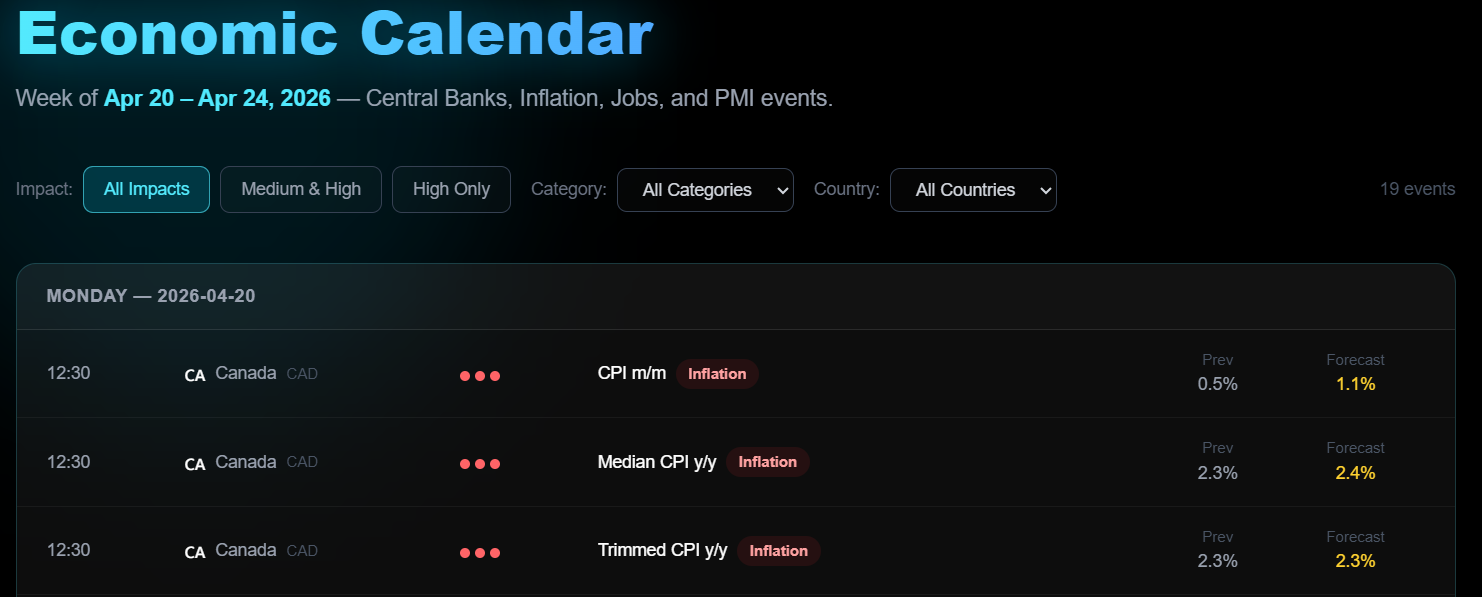
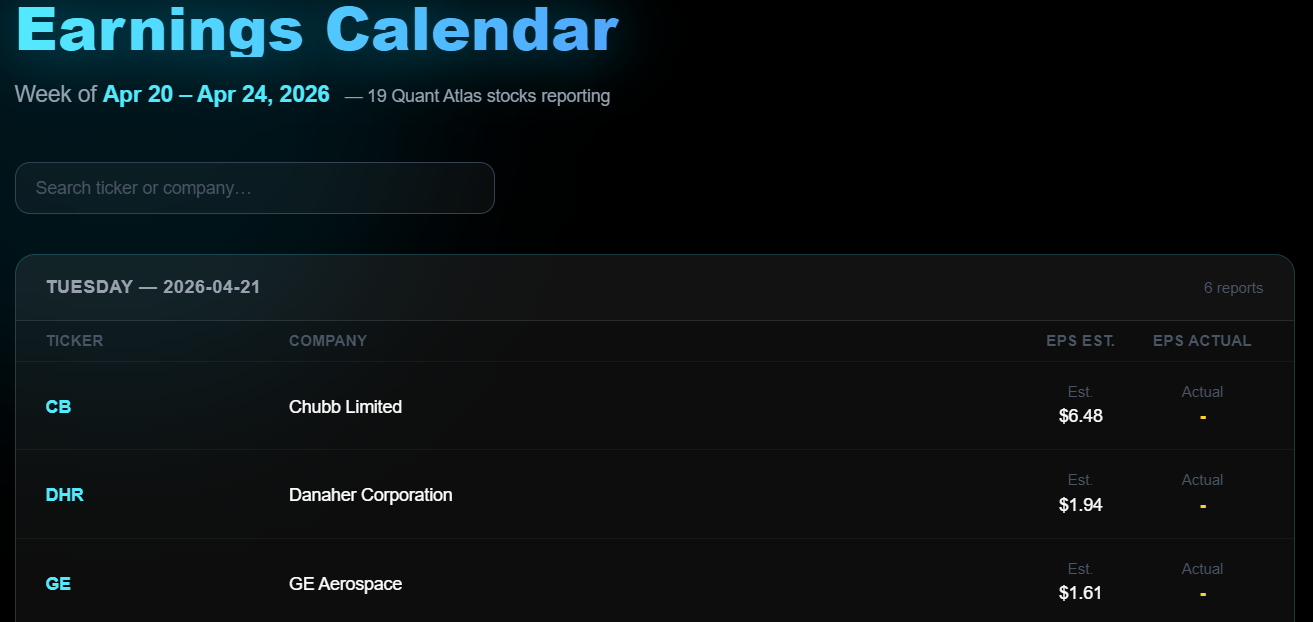
A good forecast is never just about direction. Timing matters too.
3. I examine sentiment and positioning
Markets are driven not only by data, but also by how people are positioned around that data.
This is where sentiment and positioning come in. I like to assess whether the market is complacent, fearful, crowded, or uncertain. Tools such as fear and greed measures help provide a broad read on emotional conditions, while COT reports offer a more structured look at positioning in futures markets.
If positioning is heavily one sided, the market can become vulnerable to sharp reversals. If sentiment is extremely pessimistic while price begins to stabilize, the asymmetry may improve. If optimism is excessive and the market is extended, the risk reward may worsen.
I do not treat sentiment as a standalone trigger. I treat it as an additional layer of evidence. It helps me understand whether price is moving with healthy participation or whether the move is becoming too consensus driven.
I also tend to take a look at seasonlity for extra insights.
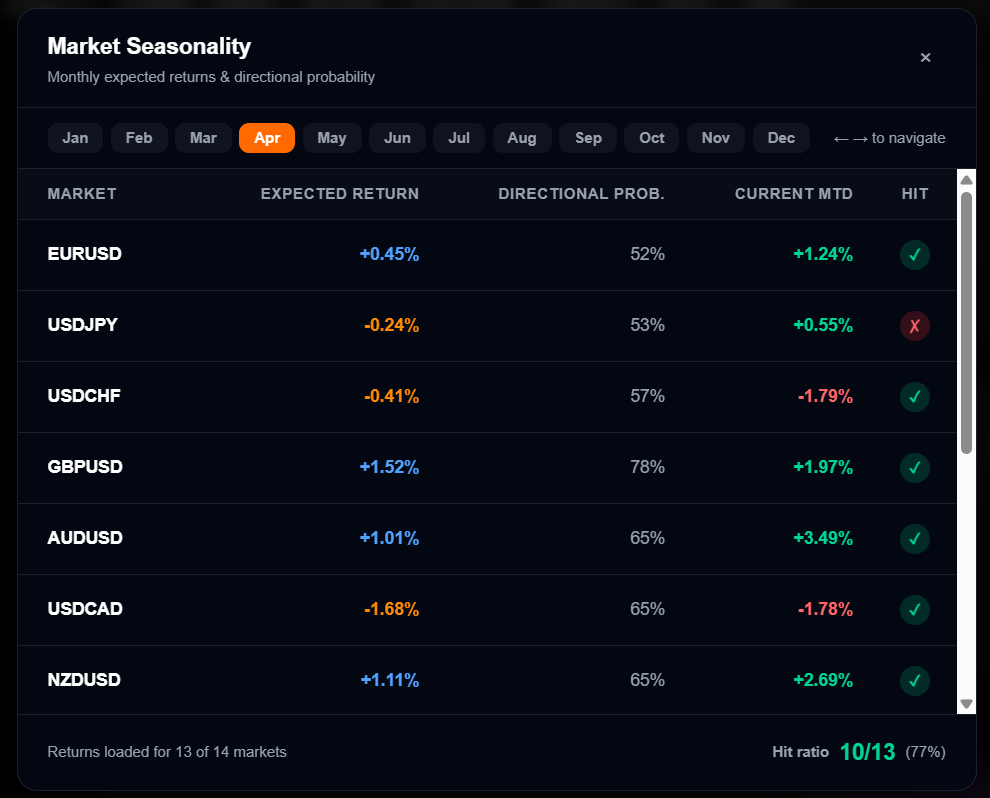
4. Then I move to price action and technical structure
Only after I have built the macro, event, and sentiment backdrop do I focus fully on price.
This is where structure matters. I study price action first, because price is the final expression of all market forces combined. It reflects information, emotion, liquidity, expectations, and positioning in real time.
From there, I use a range of technical tools to organize what I see.
I monitor moving averages to understand trend direction and trend quality. I use Bollinger Bands to assess dispersion, stretch, and reversion potential. Fibonacci retracements help me locate areas where pullbacks or reactions may become meaningful. Harmonic patterns can also provide useful structure when price action aligns with clear geometric behavior.
Alongside these tools, I also rely on proprietary indicators from Quant Atlas, namely Vision and Yubel. These are part of my effort to formalize what many traders often leave vague. Rather than relying only on discretionary chart reading, I prefer to build frameworks that can help structure decision making more objectively.
The point is not to pile indicators on top of each other. The point is confluence. I am looking for situations where multiple independent elements begin to support the same idea.
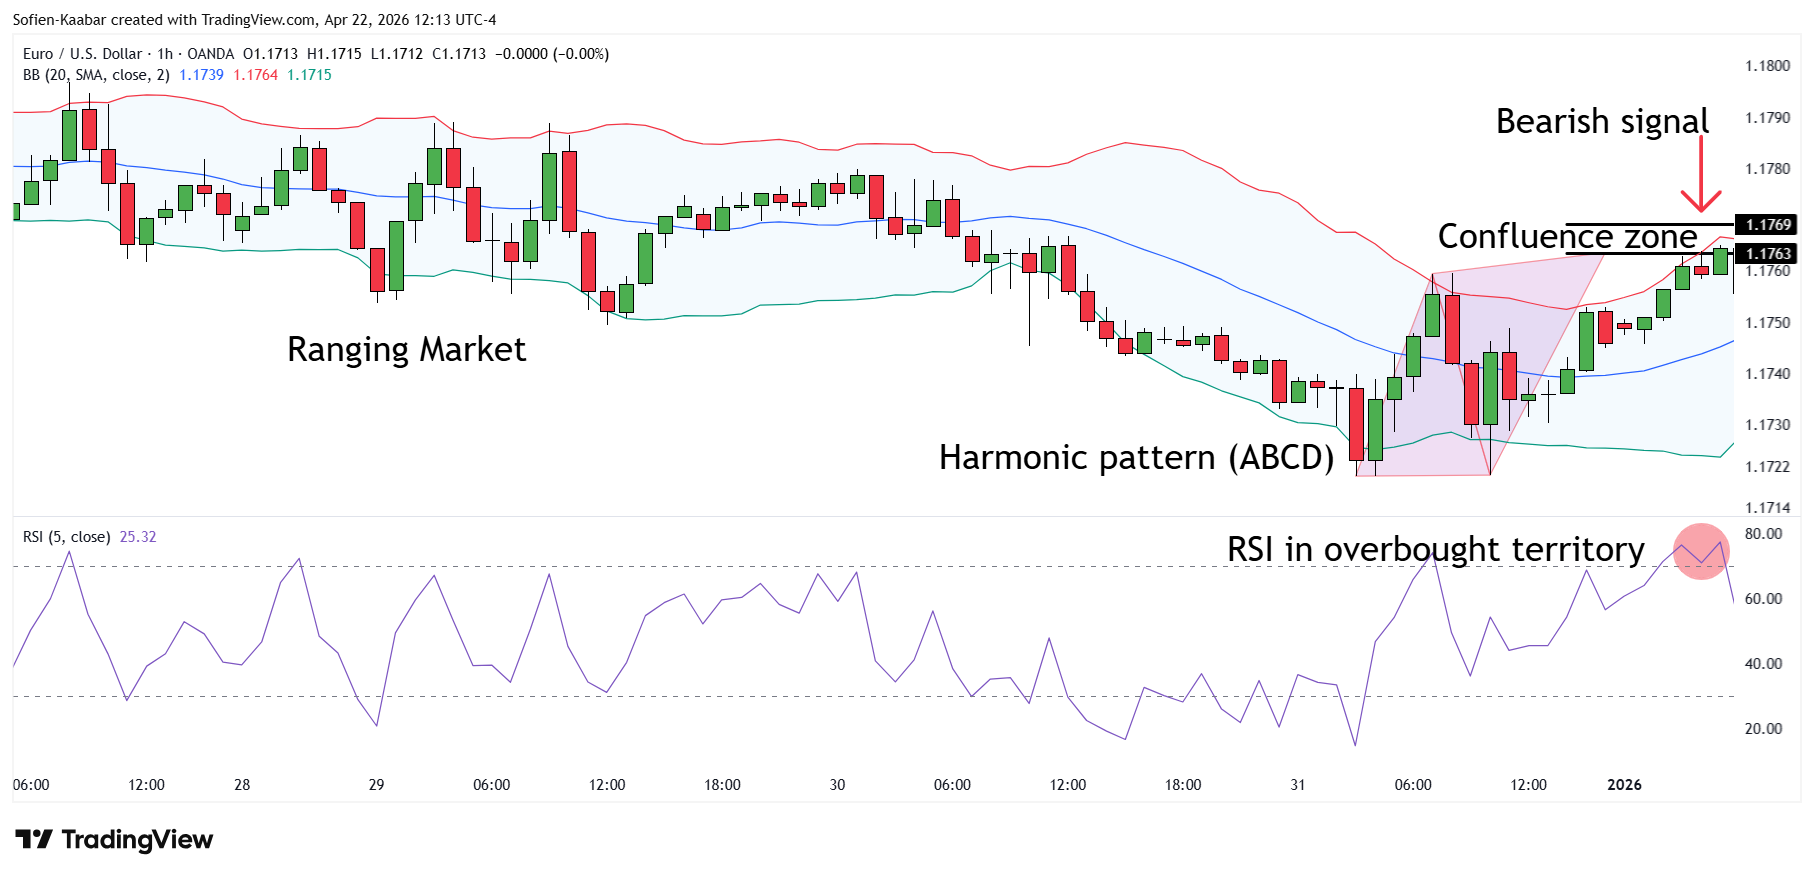
That is where forecasts become more interesting. A framework you can follow can be the following:
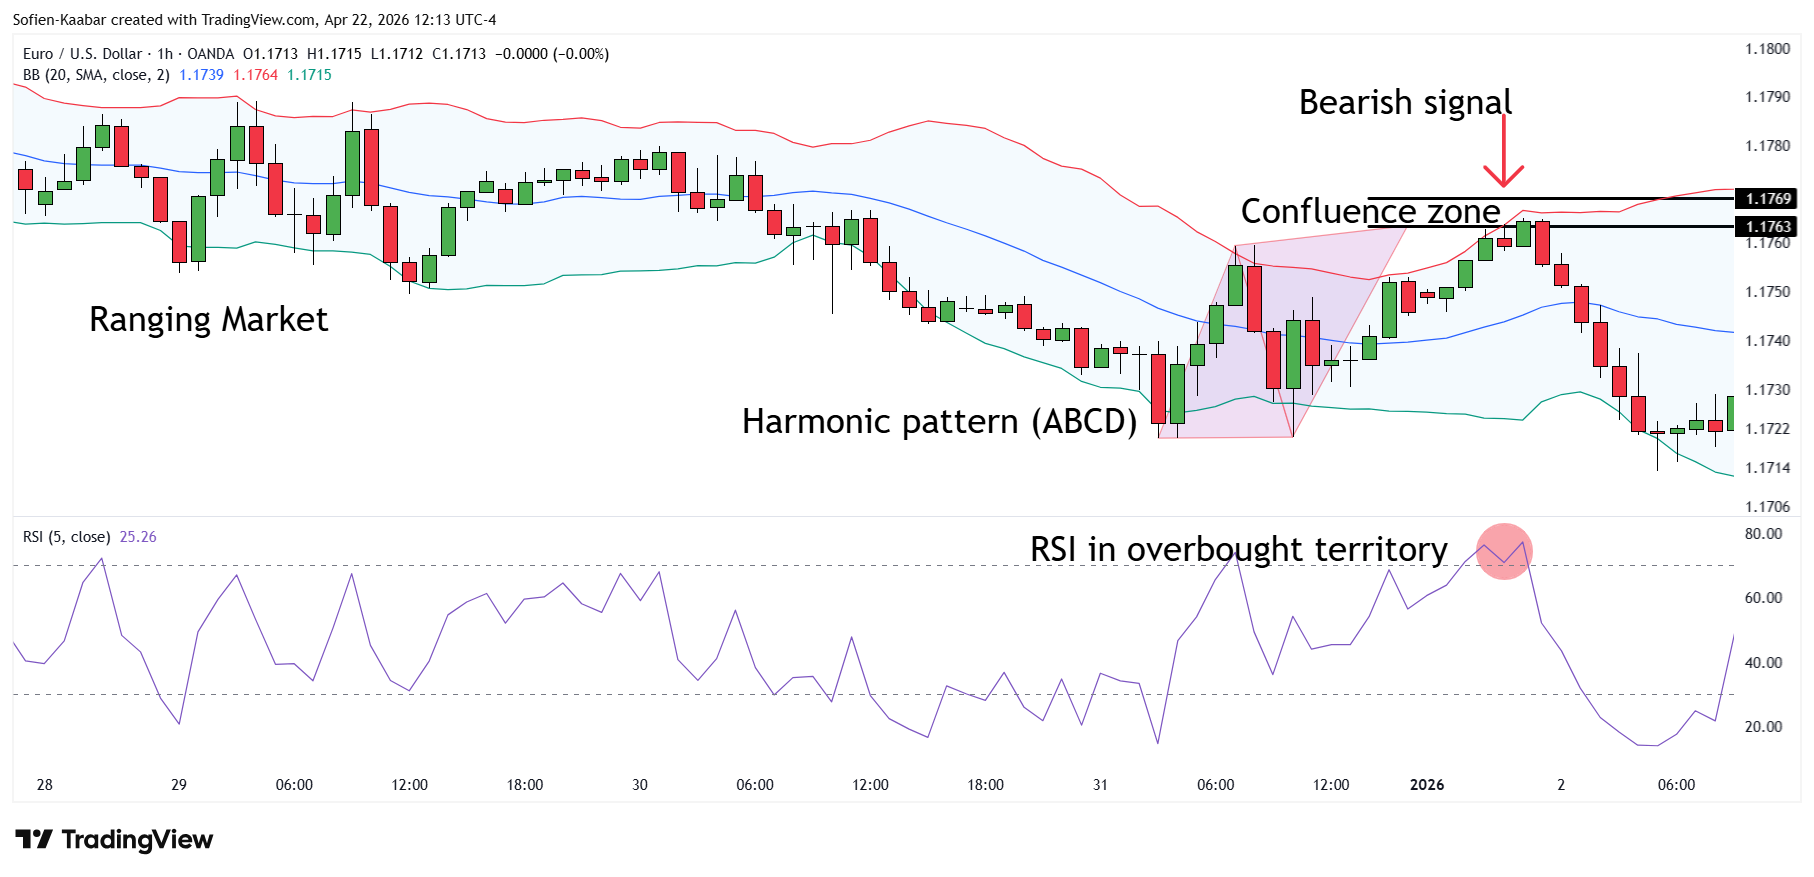
Determine whether the market is ranging or trending.
If ranging, look at Bollinger bands to see which support and resistance levels are they pointing to.
Add a confluence zone by checking if you have interesting Fibonacci retracement levels (to confirm the previous step).
Optionally, check if there’s a key moving average passing by the confluence zone.
Check for harmonic patterns (mostly ABCD and 5-0 patterns).
Take a look at the RSI and see if it’s in the oversold or overbought zone. Also, check if it’s showing any divergence.
Here’s a visual forecasting process (manual). The market is arriving to the top of its Bollinger bands, with the RSI being in the overbought area, and the price action shaping a bearish ABCD harmonic pattern.
5. I analyze volatility before deciding how aggressive to be
A setup can look attractive on paper and still be a poor trade if volatility conditions are unfavorable.
Volatility determines a great deal more than most people realize. It affects the distance to stop loss, the size of potential adverse moves, the quality of breakout behavior, and the likelihood of noise disrupting a valid idea. In some environments, volatility creates opportunity. In others, it turns execution into a mess.
This is why I pay close attention to volatility analysis, including the Echo model from Quant Atlas.
Echo helps me evaluate whether current volatility conditions are supportive or hostile for the type of opportunity I am considering. I want to know whether the market is becoming more dynamic, more unstable, or simply less attractive from a risk adjusted perspective.
Volatility is not just something to observe. It directly shapes how I trade.
6. I size positions and place stops according to volatility
Risk management is where strategy becomes real.
A lot of traders spend too much time trying to perfect entries and not enough time thinking about trade construction. For me, position sizing and stop placement are not secondary decisions. They are part of the forecast itself.
When volatility rises, stops generally need more room. That usually means position sizes should be smaller. When volatility is more controlled, position sizes can be adjusted accordingly. The market’s behavior should dictate exposure, not ego.
I want every trade to make sense not only in terms of direction, but also in terms of risk. A correct idea with poor sizing can still lead to bad outcomes. A decent idea with disciplined risk can remain valuable over time.
That discipline is one of the foundations of longevity.
7. I diversify to avoid repeating the same idea
Diversification is often misunderstood.
It is not enough to hold several positions. What matters is whether those positions are actually different. If I am long multiple assets that all depend on the same macro narrative, I may be taking the same trade several times without realizing it.
So I try to diversify as much as possible in a meaningful way. I want to avoid concentration around one hidden theme, one macro assumption, or one correlated risk exposure.
This helps reduce fragility in the portfolio and keeps me honest about how many truly independent ideas I have.
8. How this translates into strategy formulation
When I formulate a trading strategy, I am essentially combining all of these layers into one coherent process.
I begin with macro context so I understand the environment.
I review the calendar so I know what can disrupt the trade.
I assess sentiment and positioning so I understand crowd behavior.
I analyze price structure and technical confluence so I can define the setup.
I evaluate volatility so I can judge opportunity quality.
I size the position and place the stop according to actual market conditions.
And I diversify so the portfolio does not become a disguised one way bet.
That process is how I move from market observation to strategy design.
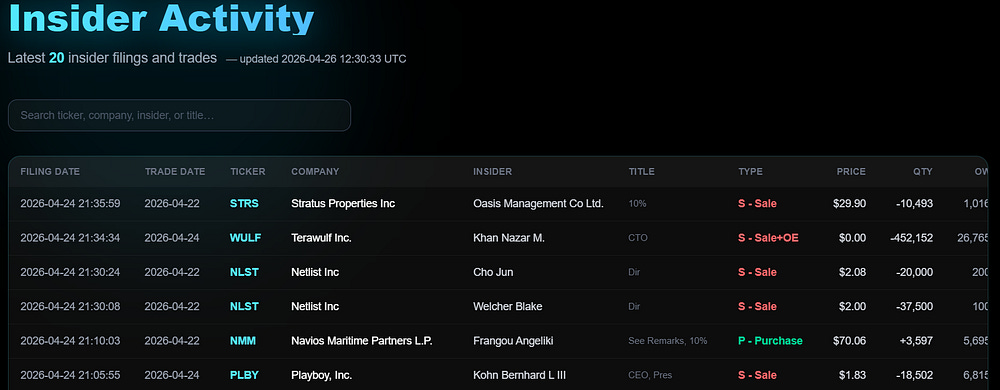
9. Optional: View insider activity to extract information
Insider activity can be very valuable. This is why, I check it regularly to understand if there are many purchases or sales from insiders.
Why I built Quant Atlas around this logic
Quant Atlas was built to reflect this same philosophy.
I wanted a framework that goes beyond isolated signals or random market commentary. I wanted something that approaches markets with structure, discipline, and a broader understanding of how different pieces fit together.
That is why Quant Atlas includes models and tools that support forecasting, conviction assessment, and market analysis across different dimensions. Vision, Yubel, and Echo are part of that ecosystem. They come from the same underlying belief: better market decisions come from combining context, structure, and risk awareness rather than chasing noise.
I built Quant Atlas to cut through market noise.
No opinions. Just quantitative, robust, quality forecasts.
Try it yourself in real time.
Final thought
Forecasting financial markets is not about certainty. It is about building a process that helps you make better decisions under uncertainty. That is how I approach markets.
I do not rely on a single chart pattern, a headline, or a sudden opinion. I work through a layered framework that starts with macro context, moves through events and sentiment, and ends with structured technical analysis, volatility assessment, and disciplined risk management. That process is what shapes my trading strategies.