
From Raw Data to Rich Predictions: Machine Learning Strategies With COT Reports in Finance
Creating a Forecasting Algorithm on the COT Report


In this article, we delve into the realm of predictive analytics, exploring how the rich insights provided by the COT report can be harnessed to enhance the capabilities of machine learning models. By deciphering the patterns within trader positions, we unlock the potential for more informed and data-driven decision-making in the complex world of finance.
Introduction to the KNN Algorithm and the COT Report
K-Nearest Neighbors (KNN) is a simple and intuitive machine learning algorithm used for both classification and regression tasks. But first, what does classification and regression mean?
Classification is a type of supervised learning where the goal is to categorize data points into predefined classes or labels. In classification, the model learns to assign a class or category to an input based on its features. The output in classification is discrete and represents a category or class label. For example, classifying emails as spam or not spam.
Regression, on the other hand, is a type of supervised learning where the goal is to predict a continuous numeric value. In regression, the model learns to establish a relationship between the input features and the output, which is a real-valued number. The output in regression is a continuous range of values, and it represents a quantity or a numerical value. For example, predicting the price of a house based on its features and forecasting stock prices.
KNN is a type of lazy learning, which means that it doesn’t build a model during training but instead memorizes the entire training dataset and makes predictions based on the similarity between new data points and the existing data points.
So, the central idea behind KNN is that objects (data points) with similar characteristics are close to each other in the feature space. It makes predictions by finding the K training examples that are closest to a given test data point in the feature space and then assigns a label or value to the test point based on the labels or values of its nearest neighbors. This means that K is a variable that you can control in the training phase.
In layman’s terms, K represents the number of nearest neighbors that the algorithm considers when making a prediction. It specifies how many of your closest neighbors you’ll consult.
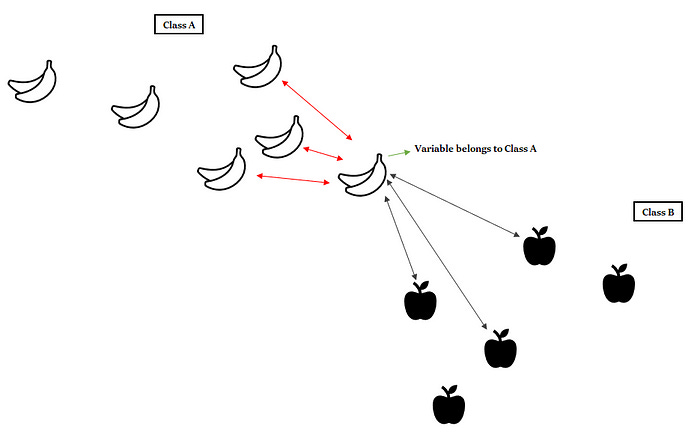
Take a look at the following illustration.
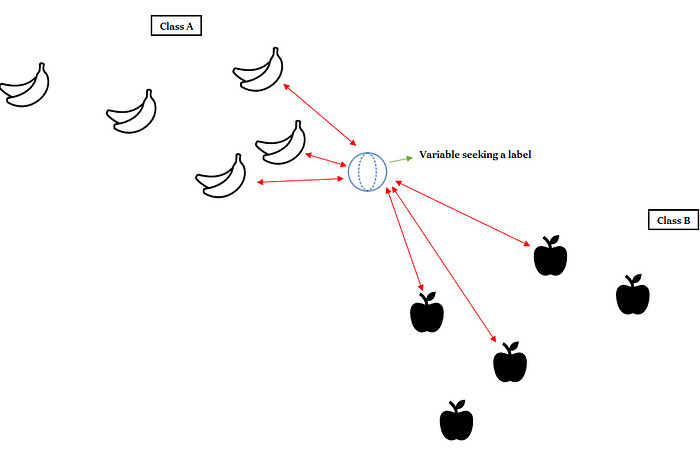
There are two classes, class A (with the bananas) and class B (with the apples). We are trying to identify the class (or label) of the blue object. The nearest neighbors seem to be the bananas, hence class A. That’s how the KNN algorithm works.
KNN can also be used for regression tasks. In KNN regression, the goal is to predict a continuous value for a new data point based on the values of its K-nearest neighbors. The steps for KNN regression are similar to KNN classification, but instead of counting class labels, you compute the average or weighted average of the target values of the K nearest neighbors to predict the value of the test point.
The Commitments of Traders (COT) report is a weekly publication by the U.S. Commodity Futures Trading Commission (CFTC) that provides insights into the positions of different market participants in futures markets. These participants include commercial hedgers, large speculators, and small traders.
The report shows the net positions of these groups, indicating whether they are bullish (expecting prices to rise) or bearish (expecting prices to fall). The net COT value is calculated by taking the difference between the total long and short positions of each group.
Analyzing the net COT value can offer some clues about potential future price movements. For instance, if large speculators have a significantly net long position, it might suggest a bullish sentiment in the market. However, it’s essential to consider other factors and use the COT report as one of several tools in forecasting. Trends can change, and market dynamics are influenced by various factors beyond the COT data.
In layman’s terms, the COT report gives a snapshot of how different groups of traders are betting on the market. If there’s a notable shift in their positions, it could indicate a possible change in the market trend. However, it’s not a crystal ball, and other factors need consideration for a more comprehensive analysis.
You can also check out my other newsletter The Weekly Market Sentiment Report that sends tactical directional views every weekend to highlight the important trading opportunities using a mix between sentiment analysis (COT reports, Put-Call ratio, Gamma exposure index, etc.) and technical analysis.
Creating the Algorithm
Let’s try to code a KNN regression example. The main task is to predict the change in the net COT value of GBP. Use the following code to do the task:
import pandas as pd
import matplotlib.pyplot as plt
import numpy as np
from sklearn.neighbors import KNeighborsRegressor

data = pd.read_excel('COT_GBP.xlsx')
data = np.reshape(np.array(data), (-1))
data = np.diff(data)

def data_preprocessing(data, num_lags, train_test_split):
    # Prepare the data for training
    x = []
    y = []
    for i in range(len(data) - num_lags):
        x.append(data[i:i + num_lags])
        y.append(data[i+ num_lags])
    # Convert the data to numpy arrays
    x = np.array(x)
    y = np.array(y)
    # Split the data into training and testing sets
    split_index = int(train_test_split * len(x))
    x_train = x[:split_index]
    y_train = y[:split_index]
    x_test = x[split_index:]
    y_test = y[split_index:]

    return x_train, y_train, x_test, y_test

# Setting the hyperparameters
num_lags = 20
train_test_split = 0.80

x_train, y_train, x_test, y_test = data_preprocessing(data, num_lags, 0.85)

# Create the model
model = KNeighborsRegressor(n_neighbors = 2)

# Fit the model to the data
model.fit(x_train, y_train)
y_pred = model.predict(x_test)

# Plotting
plt.plot(y_pred[-100:], label='Predicted Data', linestyle='--', marker = '.', color = 'red')
plt.plot(y_test[-100:], label='True Data', marker = '.', alpha = 0.7, color = 'blue')
plt.legend()
plt.grid()
plt.axhline(y = 0, color = 'black', linestyle = '--')

same_sign_count = np.sum(np.sign(y_pred) == np.sign(y_test)) / len(y_test) * 100
print('Hit Ratio = ', same_sign_count, '%')
You can find the COT GBP data from the CFTC’s website.
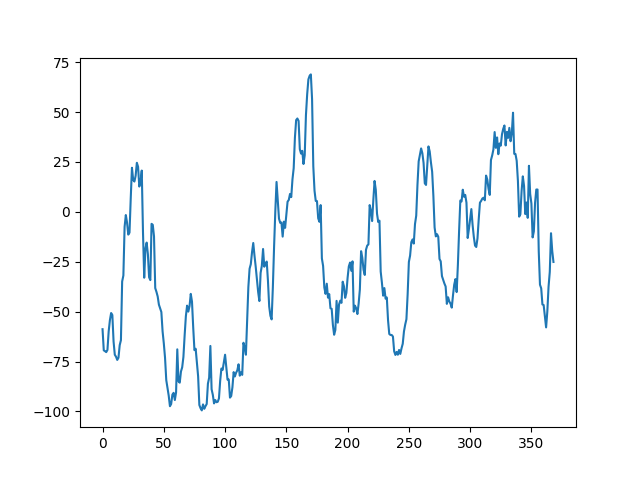
The following chart shows the comparison between actual and predicted data:

The hit ratio (accuracy) of the algorithm using a K of 2 and 20 lagged values as inputs is as follows:
Hit Ratio = 67.92 %You can also check out my other newsletter The Weekly Market Analysis Report that sends tactical directional views every weekend to highlight the important trading opportunities using technical analysis that stem from modern indicators. The newsletter is free.
If you liked this article, do not hesitate to like and comment, to further the discussion!