
Forecasting Market Cycles with Fourier Transform in Python
Markets Move in Cycles—Big and Small, Visible and Hidden


While we often think in terms of trendlines, indicators, and moving averages, there's a powerful technique borrowed from signal processing that lets us decompose market behavior into frequency components.
What Is the Fourier Transform?
At its core, the Fourier Transform (FT) converts a time-domain signal (like price data) into a frequency-domain representation. Think of it as breaking a complex price series into a combination of sine and cosine waves of various frequencies and amplitudes. Mathematically:
Where:
A: amplitude (strength of the frequency)
k: frequency
ϕ: phase shift
Using Fast Fourier Transform (FFT), we can compute this decomposition efficiently and use it to uncover hidden cycles in market data. Markets are known to have cyclical components:
Seasonal trends (e.g., energy prices rising in winter).
Investor sentiment waves.
Short-term oscillations.
Extracting dominant cycles and projecting them forward can give us a data-driven sense of market direction—especially useful for timing entries, exits, or identifying overextended prices.
Check out my newsletter that sends weekly directional views every weekend to highlight the important trading opportunities using a mix between sentiment analysis (COT report, put-call ratio, etc.) and rules-based technical analysis.

Let’s Build a Fourier Forecasting Model in Python
This section will generate synthetic market-like data, decompose it using FFT, reconstruct a smoothed signal, and forecast future prices using dominant cycles. Use the following code to generate synthetic data:
import numpy as np
import matplotlib.pyplot as plt

def generate_synthetic_data(n=300, seed=1):
    np.random.seed(seed)
    t = np.arange(n)
    trend = 0.05 * t                             # upward trend
    cycle1 = 10 * np.sin(2 * np.pi * t / 50)     # short cycle
    cycle2 = 5 * np.sin(2 * np.pi * t / 100)     # longer cycle
    noise = np.random.normal(0, 2, n)            # Gaussian noise
    synthetic_prices = 100 + trend + cycle1 + cycle2 + noise
    return synthetic_prices
Now, define the FFT function for a given time series:
def get_fourier_forecast(prices, n_predict=50, n_harmonics=10):
    prices = np.array(prices)
    n = len(prices)
    t = np.arange(n)

    # FFT
    fft_result = fft(prices)
    freqs = np.fft.fftfreq(n)

    # Sort and select dominant harmonics (skip the mean component at 0)
    amplitudes = np.abs(fft_result)
    nonzero_indices = np.argsort(amplitudes[1:])[-n_harmonics:] + 1
    indices_to_keep = np.concatenate(([0], nonzero_indices))

    # Filter FFT to keep only dominant frequencies
    filtered_fft = np.zeros_like(fft_result, dtype=complex)
    filtered_fft[indices_to_keep] = fft_result[indices_to_keep]

    # Reconstruct smoothed signal
    smoothed = ifft(filtered_fft).real

    # Forecast future prices
    t_ext = np.arange(n + n_predict)
    forecast = np.zeros_like(t_ext, dtype=float)

    for k in indices_to_keep:
        amplitude = np.abs(fft_result[k]) / n
        phase = np.angle(fft_result[k])
        freq = 2 * np.pi * freqs[k]
        forecast += amplitude * np.cos(freq * t_ext + phase)

    return smoothed, forecast, t_ext

# Generate data
synthetic_prices = generate_synthetic_data(n=300)

# Apply Fourier forecast
smoothed, forecast, t_ext = get_fourier_forecast(synthetic_prices, n_predict=50, n_harmonics=10)

# Plot
plt.figure(figsize=(14, 6))
plt.plot(synthetic_prices, label='Synthetic Prices', linewidth=2)
plt.plot(smoothed, label='Smoothed (FFT)', linestyle='--', alpha=0.7)
plt.plot(t_ext, forecast, label='Fourier Forecast', linestyle='--', color='crimson')
plt.axvline(len(synthetic_prices), color='gray', linestyle=':', label='Prediction Start')
plt.legend()
plt.title("Fourier Forecast on Synthetic Market Data")
plt.xlabel("Time Index")
plt.ylabel("Price")
plt.grid(True)
plt.tight_layout()
plt.show()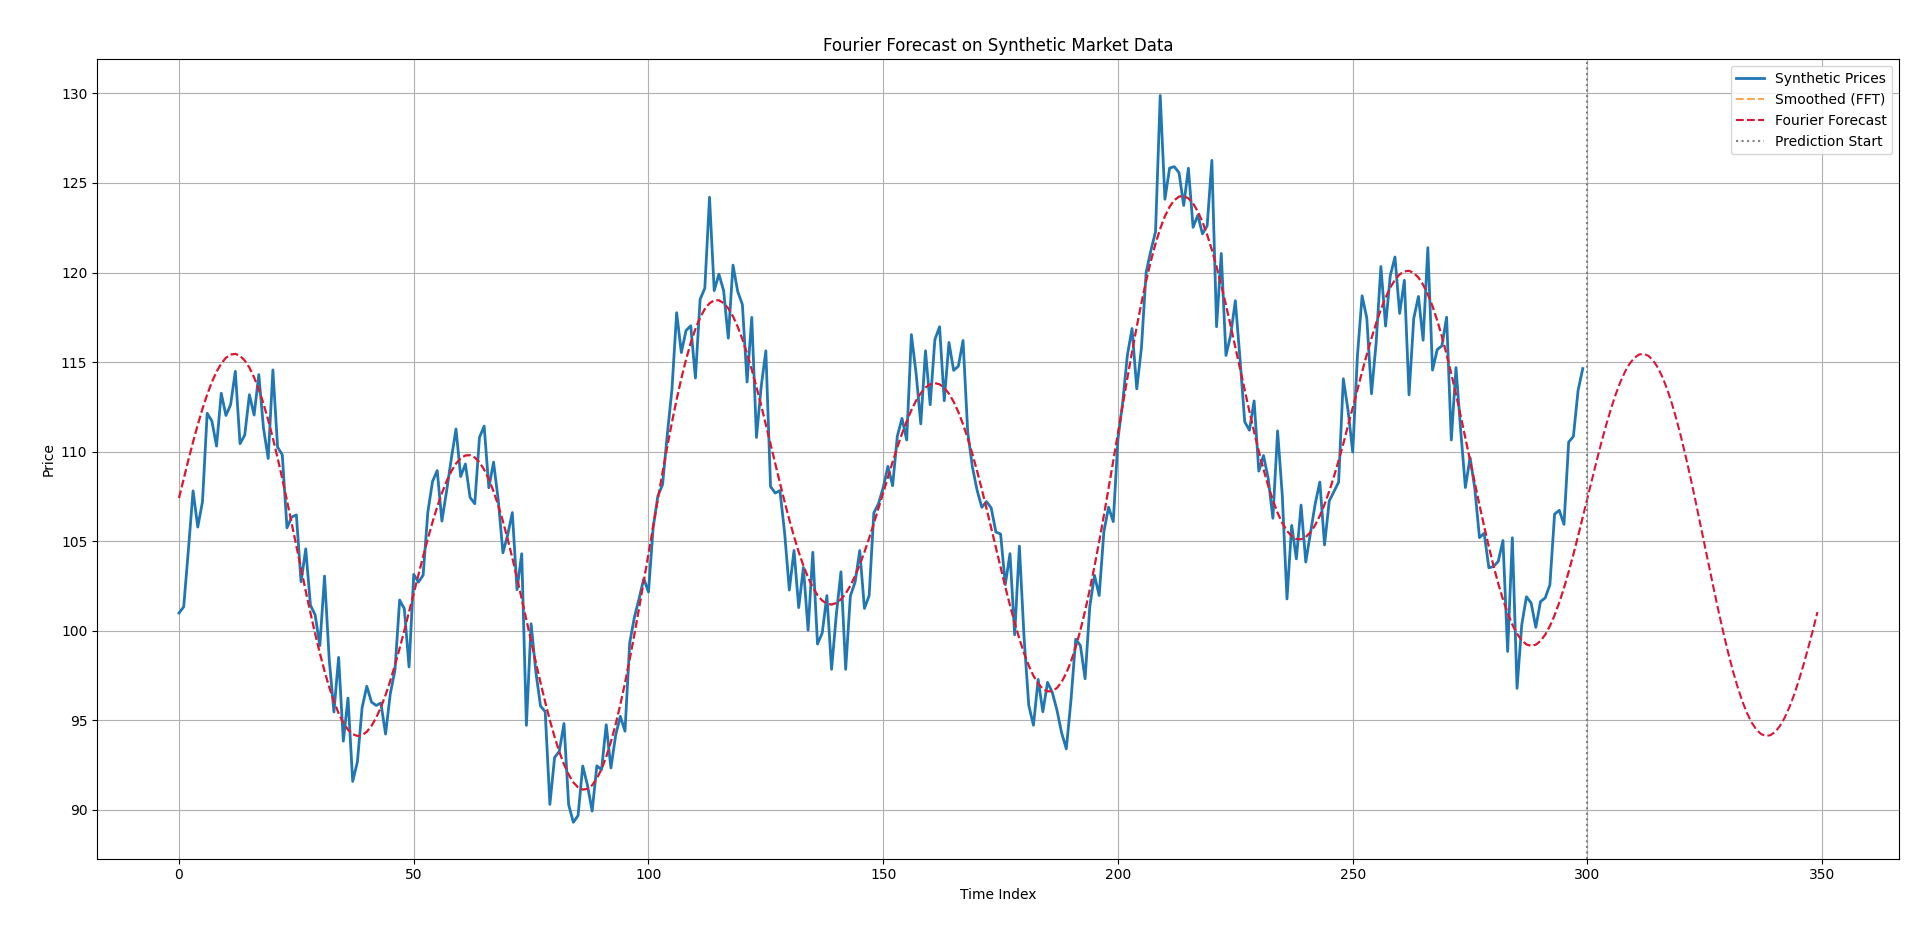
In the above chart:
The blue line is the noisy synthetic price series.
The dashed red line is a cleaned-up version using the top 10 frequency components.
The red dashed line is our forecast, projecting the dominant cycles into the future.
This technique assumes cyclical behavior persists—not ideal during regime changes or chaotic news-driven moves. It works best on mean-reverting or seasonal markets (commodities, FX, volatility). Fourier doesn't account for volatility clustering or asymmetric price behavior. Use it as a confirmation tool for trend timing or reversal zones—not standalone.
