Financial Pattern Recognition & Trend Following in Python.
Creating a Trend Following Strategy Based on Pattern Recognition.
Pattern recognition-infused trend following strategy? This is too fancy of a name for such a simple strategy. This article discusses an idea of transforming data and applying classical techniques onto it. First, we will discuss and code a new type of charting I regularly use, then, we will discuss a simple pattern before finally, presenting the strategy and how to find signals.
I have just released a new book after the success of my previous one “The Book of Trading Strategies”. It features advanced trend-following indicators and strategies with a GitHub page dedicated to the continuously updated code. Also, this book features the original colors after having optimized for printing costs. If you feel that this interests you, feel free to visit the below Amazon link, or if you prefer to buy the PDF version, you could contact me on LinkedIn.
A New Candlestick Charting System
Candlesticks are a quick way to understand OHLC data and detect patterns. It is very straightforward and easy to interpret. A bullish (typically green) candle is when the market closes above its opening price. A bearish (typically red) candle is when the market closes below its opening price.
Now, the alternative candlestick charting system is extremely simple and just averages out a low period past candlesticks. To create the K’s Candlestick chart, we need to transform the prices using the simple moving average formula:
Calculate the n-period moving average of the opening price.
Calculate the n-period moving average of the high price.
Calculate the n-period moving average of the low price.
Calculate the n-period moving average of the close price.
For this study, we will use a 5-period moving average.
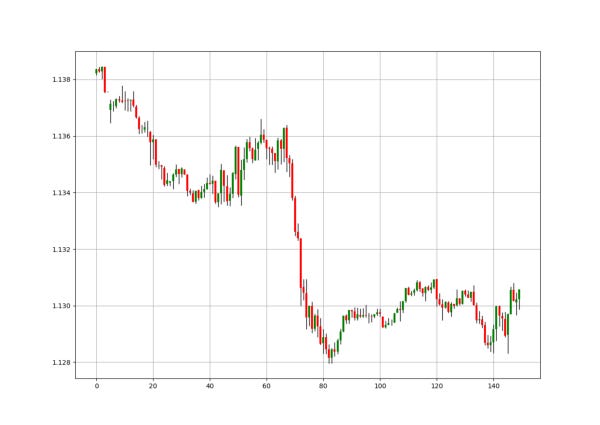
Then, we will treat the new four columns as the candlestick data while being careful from using them in trading as they are not real prices, but simple moving averages. We are interested in visually interpreting them. The charts below show the difference between the normal candlestick chart and the K’s candlestick chart.
The above plots show the EURUSD charted differently. The period used is 5 but also lower periods can be used. We can notice how smoother the K’s candlestick chart is compared to the noisy regular chart. By noisy, the meaning here is on the interpretability of the trend. When successive red or green candles are observed, the trend is easier to be determined. The choice of the period is subjective. We are interested in two things when analyzing the market using K’s candlesticks:
Interpretability of the trend: Similar to the Heikin-Ashi, the K’s candlestick chart smoothen the data in order to remove the short-term noise and to deliver a clearer picture of the current trend.
Pattern Recognition: Doji and exhaustion patterns are more prevalent in the K’s candlesticks and therefore add a confirmation factor. They also work better than in regular charts according to my small personal experience.
def adder(data, times):

    for i in range(1, times + 1):

        new = np.zeros((len(data), 1), dtype = float)

        data = np.append(data, new, axis = 1)
return datadef deleter(data, index, times):
for i in range(1, times + 1):
data = np.delete(data, index, axis = 1) return data
def jump(data, jump):
data = data[jump:, ]
return datadef rounding(data, how_far):
data = data.round(decimals = how_far)
return datadef ma(data, lookback, close, where):
data = adder(data, 1)
for i in range(len(data)):
try:
data[i, where] = (data[i - lookback + 1:i + 1, close].mean())
except IndexError:
pass
data = jump(data, lookback)
return datadef k_candlesticks(Data, opening, high, low, close, lookback, where):
# Adding the necessary columns
Data = adder(Data, 4)
# Averaging the Open
Data = ma(Data, lookback, opening, where)
# Averaging the High
Data = ma(Data, lookback, high, where + 1)
# Averaging the Low
Data = ma(Data, lookback, low, where + 2)
# Averaging the Close
Data = ma(Data, lookback, close, where + 3)
return DataPattern Recognition: The Doji Pattern
Pattern recognition is part of technical analysis. This section will specifically deal with a very simple pattern called the Doji. We will use an algorithm that detects it on K’s candlestick charts instead of regular charts.
The bullish Doji pattern is composed of a candle that has its closing price equal to its opening price. It usually occurs after downward trending price action and is considered a bullish reversal or a correction pattern.
The bullish Doji pattern is based on the psychology that the balance of power has been equalized after trending in one direction.
The bearish Doji pattern is composed of a candle that has its closing price equal to its opening price. It usually occurs after upward trending price action and is considered a bearish reversal or a correction pattern.
If you are also interested by more technical indicators and strategies, then my book might interest you:
Creating the Trend Following Strategy
The strategy is rather simple. Trend following is the act of initiating trades in the direction of the aggregate overall direction of the market. In a rising market, we must look for buying opportunities while in a falling market, we must look for selling opportunities.
The strategy this time will have the following rules:
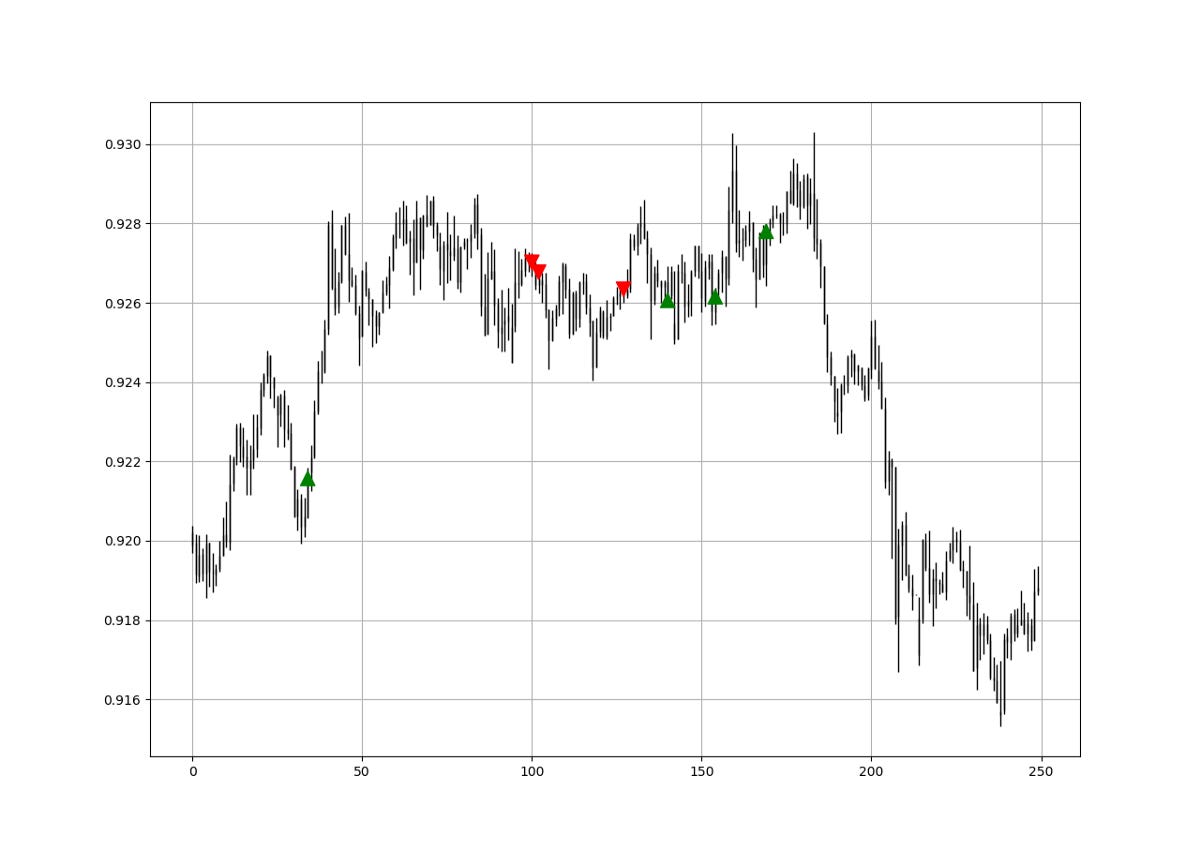
Buy (Long) whenever a Doji appears on the K’s candlestick chart while the market is above the 50-period moving average.
Sell (Short) whenever a Doji appears on the K’s candlestick chart while the market is below the 50-period moving average.
for i in range(len(my_data)):

    if abs(my_data[i, 4] - my_data[i, 7]) < 0.0001 and \
       my_data[i, 6] <= my_data[i, 8] and my_data[i, 7] >=    my_data[i, 8] and my_data[i, 7] < my_data[i - 3, 7] \
           and my_data[i - 1, 9] == 0:

        my_data[i, 9] = 1
if abs(my_data[i, 7] - my_data[i, 4]) < 0.0001 and \
my_data[i, 5] >= my_data[i, 8] and my_data[i, 7] <= my_data[i, 8] and my_data[i, 7] > my_data[i - 3, 7] \
and my_data[i - 1, 10] == 0:
my_data[i, 10] = -1The charts show the signals generated using the strategy which may be tweaked and optimized as needed. The idea is to have the trend by your side as well as a pattern that tells you the market should continue in this trend.
Conclusion
Remember to always do your back-tests. You should always believe that other people are wrong. My indicators and style of trading may work for me but maybe not for you.
I am a firm believer of not spoon-feeding. I have learnt by doing and not by copying. You should get the idea, the function, the intuition, the conditions of the strategy, and then elaborate (an even better) one yourself so that you back-test and improve it before deciding to take it live or to eliminate it. My choice of not providing specific Back-testing results should lead the reader to explore more herself the strategy and work on it more.
To sum up, are the strategies I provide realistic? Yes, but only by optimizing the environment (robust algorithm, low costs, honest broker, proper risk management, and order management). Are the strategies provided only for the sole use of trading? No, it is to stimulate brainstorming and getting more trading ideas as we are all sick of hearing about an oversold RSI as a reason to go short or a resistance being surpassed as a reason to go long. I am trying to introduce a new field called Objective Technical Analysis where we use hard data to judge our techniques rather than rely on outdated classical methods.


