


Technical Simple Pattern Recognition (TSPR) is the application of a few conditions based on price and price-derived calculations in order to derive buy and sell signals.
What are Market Patterns?
A pattern in financial markets is a recognizable and recurring structure in price movement or trading behavior. Patterns emerge because markets are driven by collective human psychology—fear, greed, optimism, and doubt—which often repeat in predictable ways.
Traders and analysts study these formations to anticipate future price action, identify entry and exit points, and better understand the underlying balance between supply and demand.
Broadly, market patterns can be divided into:
Candlestick patternsClassic price patternsTiming patternsHarmonic patternsTechnical simple patterns
Beyond technical structures, there are also behavioral and cyclical patterns. For example, intraday seasonalities like the opening rally or end-of-month effect emerge from repeated institutional flows. Larger cycles such as business cycles, election cycles, or commodity supercycles show how macroeconomic and political forces shape markets over time. Together, these patterns provide a multi-layered perspective, visual, statistical, and behavioral, that traders use to spot opportunities and manage risk.
Technical simple patterns is a classification I use to group certain patterns together. These patterns can have extremely simple conditions (such as a close price high than the close price from 2 periods ago), and are generally abundant signal-wise.
Coding the Market Pattern
NR7 stands for Narrow Range 7. It means: Today’s (or current bar’s) trading range (High − Low) is the smallest of the last 7 bars. It’s a volatility compression signal.
Markets alternate between contraction (quiet, small bars) and expansion (big breakout moves).
NR7 marks extreme contraction → traders watch for an explosive move afterwards.
Think of it like a spring being compressed:
Each day/bar, the range is shrinking.
On the 7th day, it’s the narrowest range in over a week → market is “coiled.”
Often followed by a breakout, but the direction is unknown (so you combine it with trend, S/R, or breakouts).
Use the following code in PineScript (TradingView) to visualize the pattern.
//@version=5
indicator("NR7 Pattern", overlay=true)

// Calculate range
range_value = high - low

// Check NR7 condition
nr7 = range_value == ta.lowest(range_value, 7)

// Plot
plotshape(nr7, title="NR7", location=location.abovebar,
          color=color.blue, style=shape.labeldown, text="NR7")
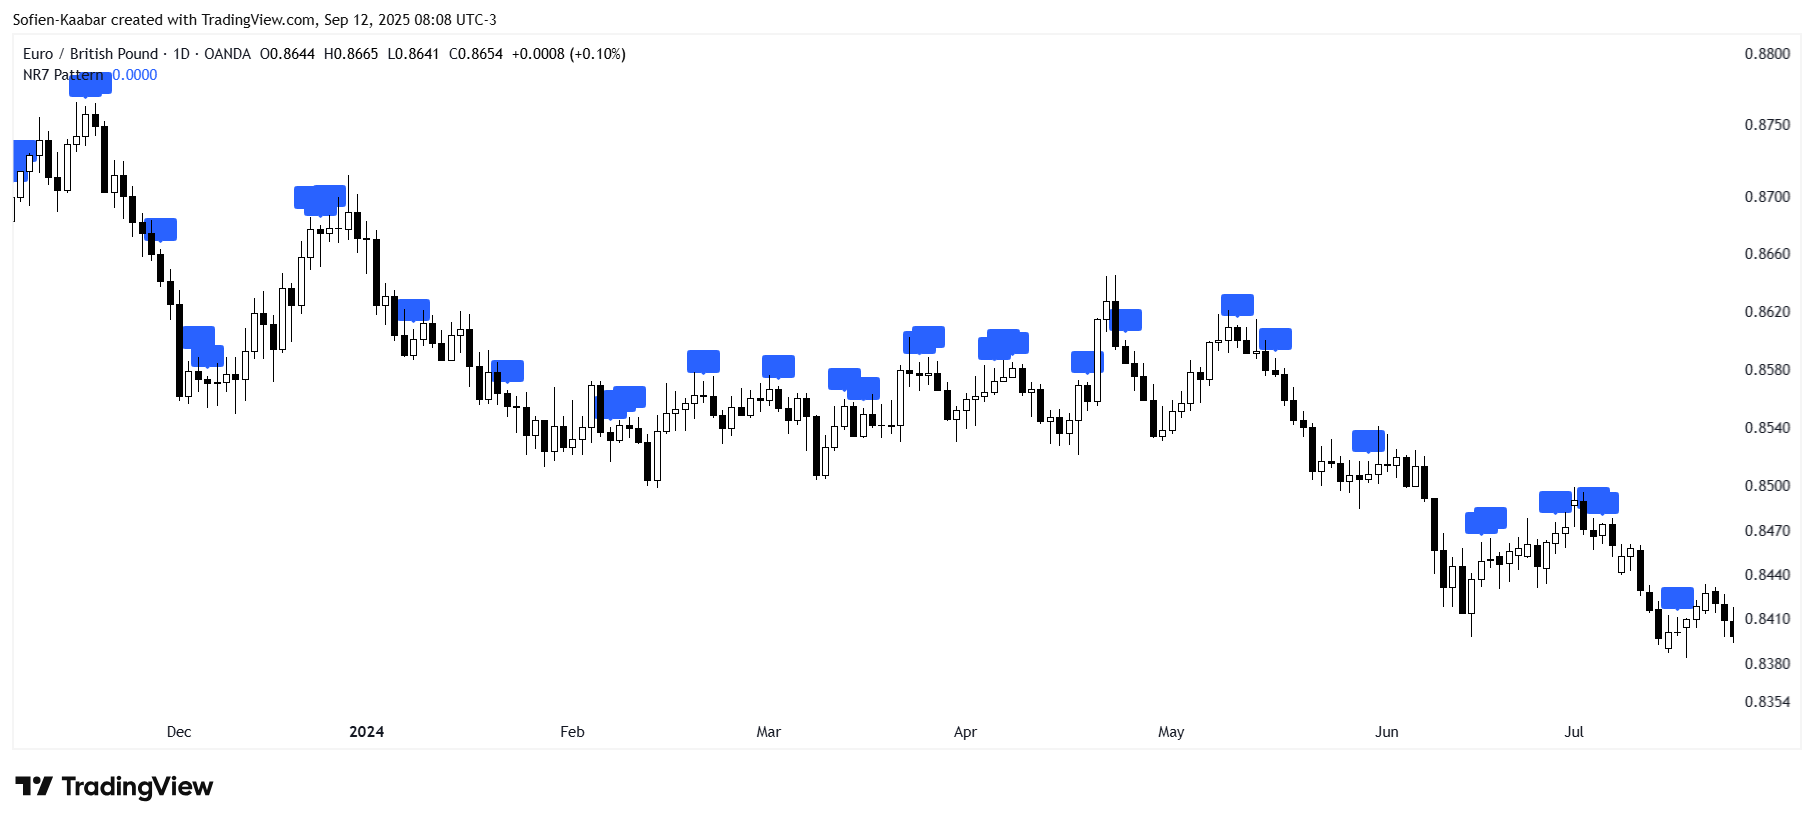
The following chart shows an example of the pattern up close.
New Book ALERT🚀
Code the Charts. Redefine Technical Analysis.
Modern patterns, Fibonacci, and next-gen indicators, all engineered in Python 🐍.
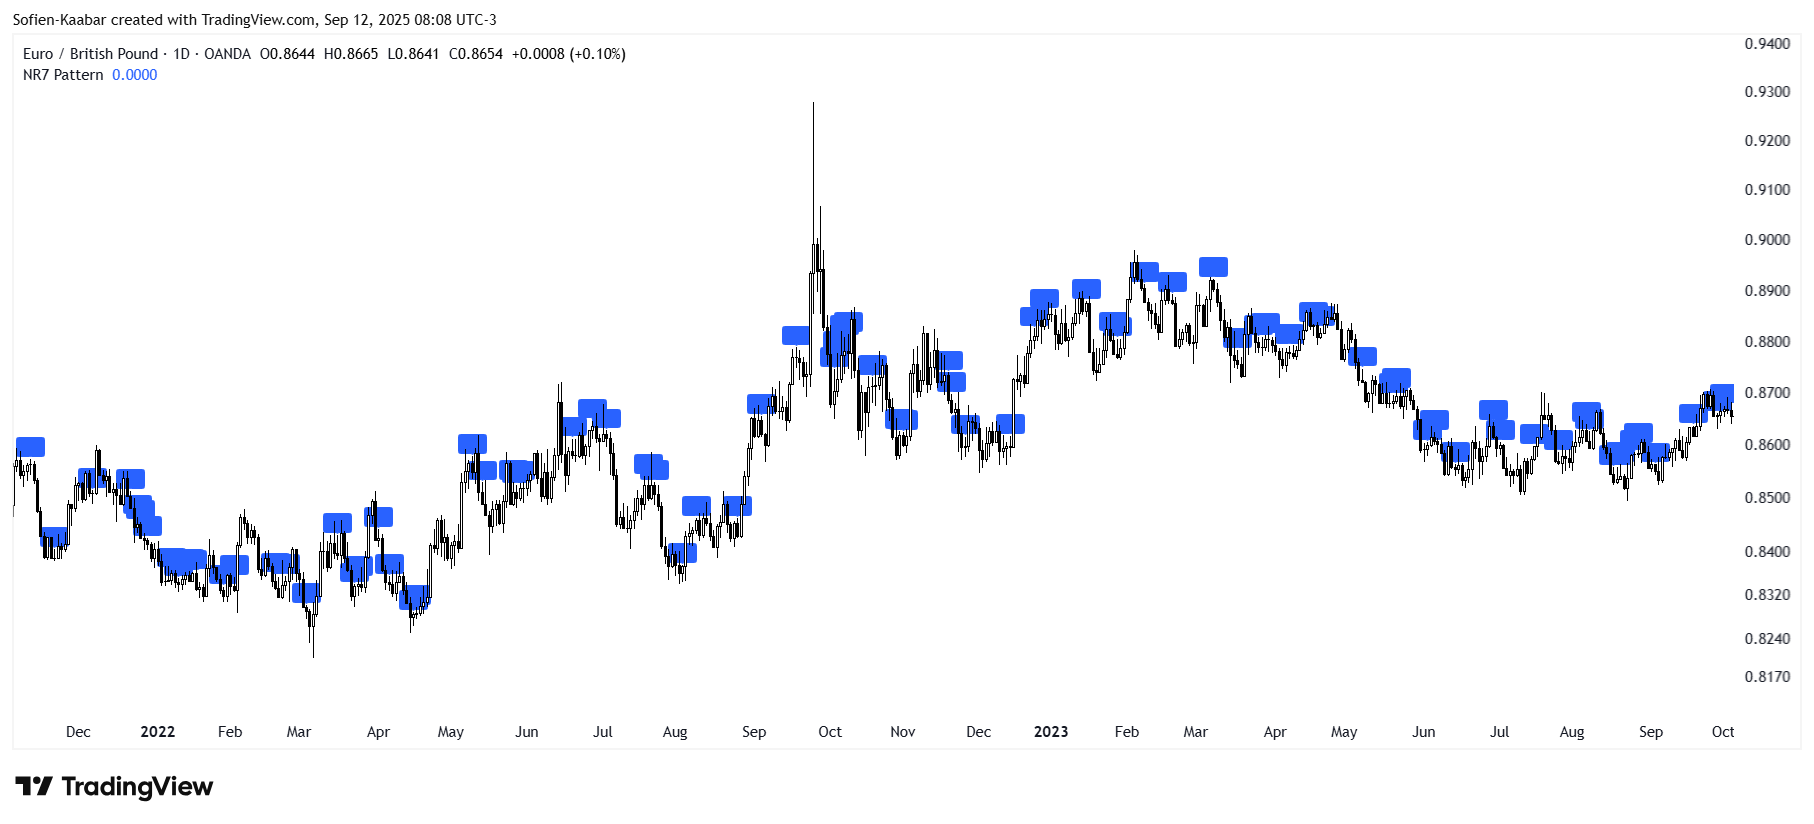
Zooming out gives an idea of the frequency of the signals.
The default way to use this pattern is as follows.
Wait for price to break above the NR7 high → possible long. Break below the NR7 low → possible short.
In an uptrend, prefer breakouts above NR7 highs. In a downtrend, prefer breakouts below NR7 lows.
Place stop just beyond the opposite side of the NR7 candle.
Aim for a multiple of ATR (volatility) or nearby S/R.
NR7 is a volatility squeeze signal. It doesn’t predict direction, but it warns you: “get ready, a strong move is coming.”