
Exotic Market Patterns Simplified VII - Three-Bar Reversal Pattern
Coding and Charting Lesser Known Market Patterns


This article will part of a series of posts that present exotic and unpopular market patterns in an easy and straightforward manner. Technical Simple Pattern Recognition (TSPR) is the application of a few conditions based on price and price-derived calculations in order to derive buy and sell signals.
I will try to present each one with functioning code that shows how to use and interpret it:
TD Differential patternTD Reverse Differential patternTD Anti Differential patternFractalsOutside barsNR7 patternThree-Bar Reversal pattern👈🏻
Deliberation Pattern
What are Market Patterns?
A pattern in financial markets is a recognizable and recurring structure in price movement or trading behavior. Patterns emerge because markets are driven by collective human psychology—fear, greed, optimism, and doubt—which often repeat in predictable ways.
Traders and analysts study these formations to anticipate future price action, identify entry and exit points, and better understand the underlying balance between supply and demand.
Broadly, market patterns can be divided into:
Candlestick patternsClassic price patternsTiming patternsHarmonic patternsTechnical simple patterns
Beyond technical structures, there are also behavioral and cyclical patterns. For example, intraday seasonalities like the opening rally or end-of-month effect emerge from repeated institutional flows. Larger cycles such as business cycles, election cycles, or commodity supercycles show how macroeconomic and political forces shape markets over time. Together, these patterns provide a multi-layered perspective—visual, statistical, and behavioral—that traders use to spot opportunities and manage risk.
Technical simple patterns is a classification I use to group certain patterns together. These patterns can have extremely simple conditions (such as a close price high than the close price from 2 periods ago), and are generally abundant signal-wise.
Do you want to master Deep Learning techniques tailored for time series, trading, and market analysis?
My book breaks it all down from basic Machine Learning to complex multi-period LSTM forecasting while going through concepts such as Fractional Differentiation and Forecasting Thresholds. Get your copy here 📖!
Coding the Market Pattern
Price action often leaves clues about turning points before indicators catch up. One simple yet powerful signal is the Three-Bar Reversal Pattern. As the name suggests, it uses just three consecutive candles to mark potential reversals in market direction. Despite its simplicity, it captures the shift in control between buyers and sellers and is widely used in both intraday and swing trading.
The Three-Bar Reversal is a short-term pattern that signals a possible trend reversal. It comes in two forms:
Bullish Three-Bar Reversal (after a downtrend):
Bar 1: Strong bearish candle (sellers in control).
Bar 2: A candle that stalls the momentum — often a smaller bar or doji.
Bar 3: A strong bullish candle that closes above the high of Bar 2, signaling a shift in momentum.
Bearish Three-Bar Reversal (after an uptrend):
Bar 1: Strong bullish candle.
Bar 2: A pause or small candle showing hesitation.
Bar 3: A strong bearish candle that closes below the low of Bar 2, confirming sellers have taken over.
The logic is straightforward:
The first bar shows continuation of the existing trend.
The second bar represents indecision — buyers or sellers are losing steam.
The third bar shows a clear reversal in control, with conviction in the opposite direction.
Bullish setup: Look for the pattern after a decline. Entry often placed above the high of Bar 3. Stop-loss can be set below the low of Bar 3 (or Bar 1 for more safety).
Bearish setup: Look for the pattern after a rally. Entry often placed below the low of Bar 3. Stop-loss above the high of Bar 3 (or Bar 1 for more safety).
Use the following code in PineScript (TradingView) to visualize the pattern.
//@version=5
indicator("Three-Bar Reversal Pattern", overlay=true)
// Helper functions
isBullish(c) => close[c] > open[c]
isBearish(c) => close[c] < open[c]
// Bullish Three-Bar Reversal
bullish = isBearish(2) and // First bar: bearish
(high[1] - low[1]) < (high[2] - low[2]) and // Second bar: smaller/indecision
isBullish(0) and close > high[1] // Third bar: bullish close above bar 2 high
// Bearish Three-Bar Reversal
bearish = isBullish(2) and // First bar: bullish
(high[1] - low[1]) < (high[2] - low[2]) and // Second bar: smaller/indecision
isBearish(0) and close < low[1] // Third bar: bearish close below bar 2 low
// Plot signal
plotshape(bullish[1], style = shape.triangleup, color = color.green, location = location.belowbar, size = size.small)
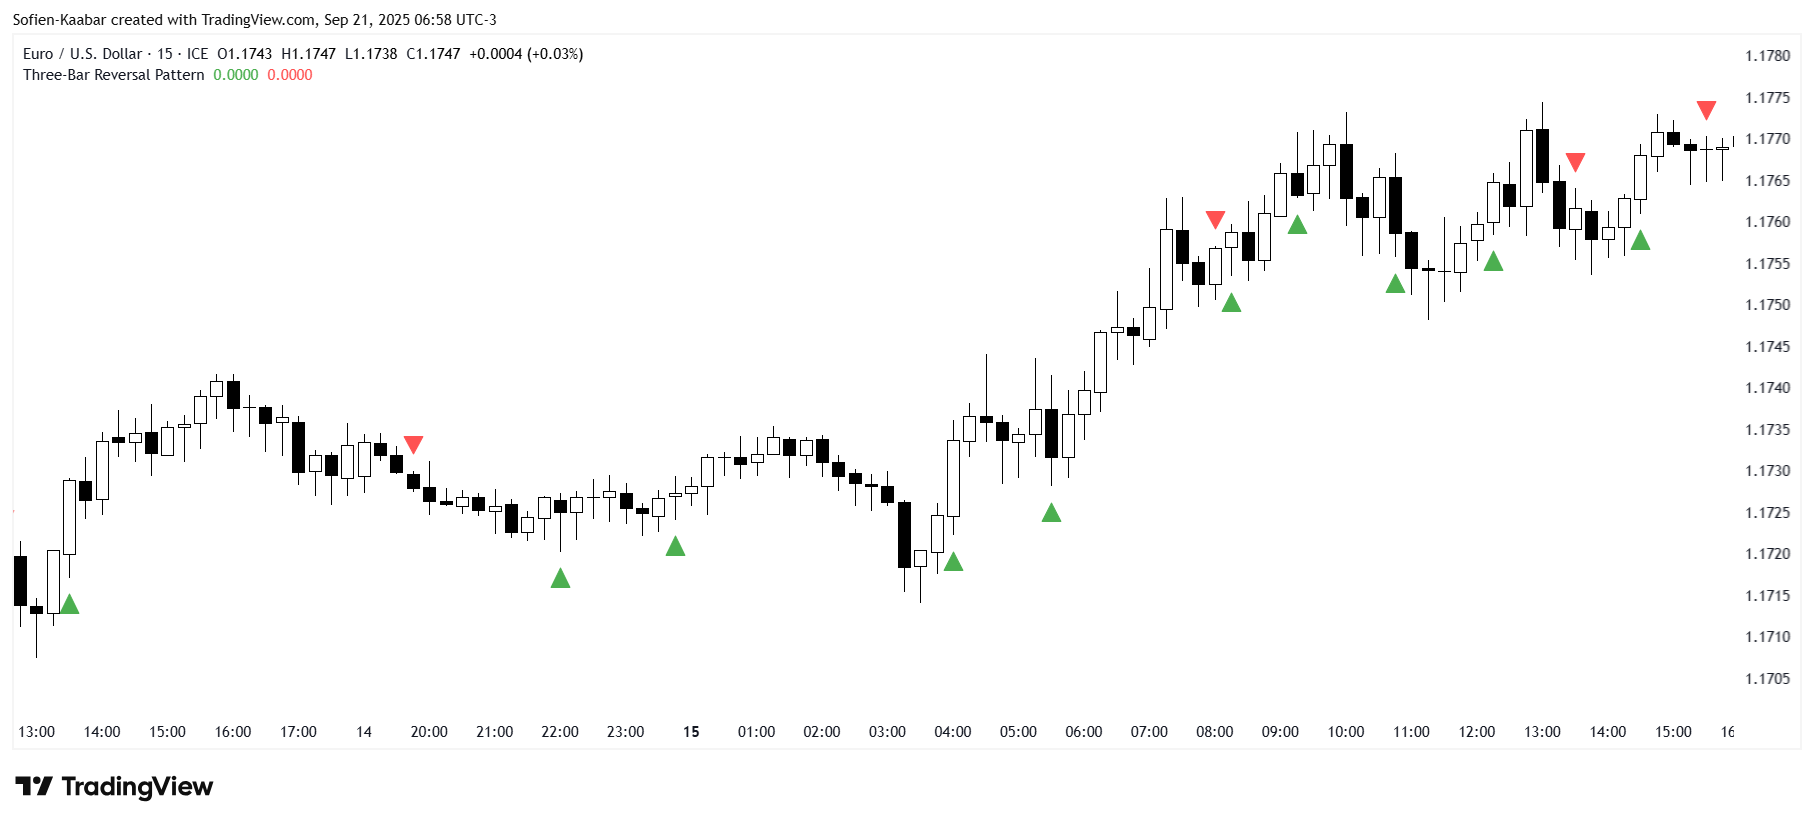
plotshape(bearish[1], style = shape.triangledown, color = color.red, location = location.abovebar, size = size.small)The following chart shows an example of the pattern up close.
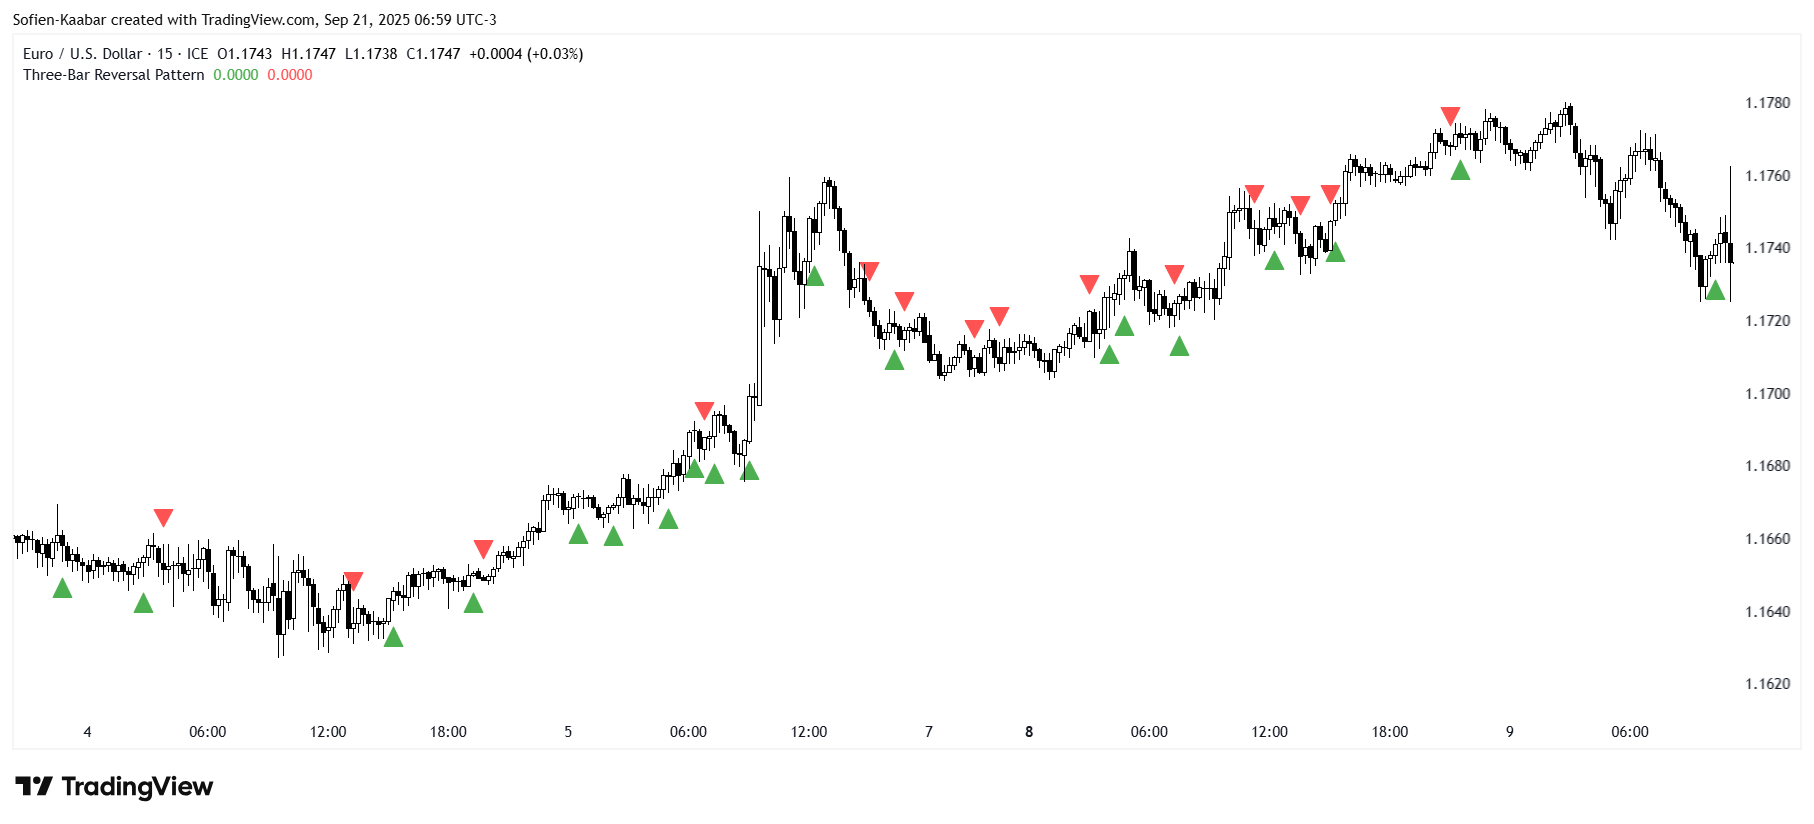
Zooming out gives an idea of the frequency of the signals.
✨ The Weekly Market Sentiment Report is evolving into The Signal Beyond 🚀.
This isn’t just a sentiment check anymore. It’s becoming a full market intelligence package with expanded technical scorecards, refined sentiment models, and machine learning forecasts. From classic tools that have stood the test of time to fresh innovations like multi-market RSI heatmaps, volatility regime dashboards, and pairs trading recommendation system, the new report is designed to give you a sharper edge in navigating the markets.
Free trial available.