
Excerpt of the Weekly Market Sentiment Report
The Weekly Coalescence Sentiment Report: 01/05/2022 - 08/05/2022


This report covers the weekly market sentiment and positioning and any changes that have occurred which might present interesting configurations on different asset classes with a specific focus on currencies. The below shows the table of contents of the report:
The COT Report
Introduction to the COT Report
EUR Currency
CHF Currency
GBP Currency
JPY Currency
CAD Currency
Interesting Cross Ideas
Historical Track Record
The Chaos Impact Index
Introduction to the Chaos Impact Index
EUR Currency
CHF Currency
GBP Currency
JPY Currency
CAD Currency
S&P500
Gold
The White Index
Introduction to the White Index
S&P500
Historical Track Record
Vision
Introduction to Vision
S&P500
Historical Track Record
The VIX
Introduction to the VIX
S&P500
Historical Track Record
The Millennium Forecast
Introduction to the Millennium Forecast
ISM PMI
Historical Track Record
Bitcoin Tactical Sentiment Index
Introduction to the Bitcoin Tactical Sentiment Index
Bitcoin
Historical Track Record
Disclosure

1. The COT Report

As mentioned in the introductory post, the COT report shows the positioning of the market with respect to a few underlying assets and currencies. The COT strategies are as follows:
The COT1 strategy uses a normalization technique to detect imminent market shifts while minimizing lag as much as possible.
The COT2 strategy uses a statistical technique to detect sentiment extremes that are bound to reverse.
The COT3 strategy uses a deceleration filter to detect exhaustion in positioning trends.
The COT4 strategy uses a pattern recognition technique to detect imminent reversals in sentiment.
EUR Currency
Signals from the EUR currency can be used to understand the expected directional bias of the USDEUR pair or any other EUR pair.
The following signal chart shows the latest 250 data with the COT1 signals.

The charts use major proxies versus the USD: EUR is represented by USDEUR, CHF is represented by USDCHF, GBP is represented by USDGBP, JPY is represented by USDJPY, and CAD is represented by USDCAD.
The following signal chart shows the latest 250 data with the COT2 signals.
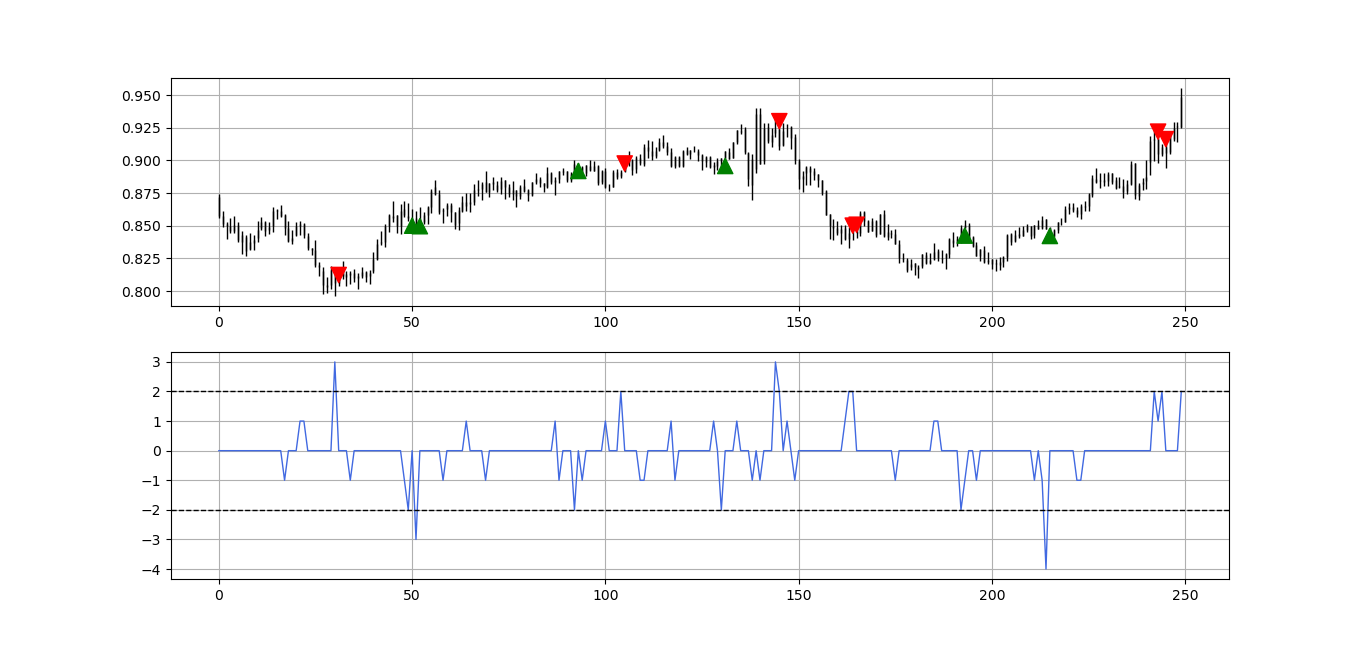
Green arrows point to a bullish sentiment signal while red arrows point to a bearish sentiment signal.
The following signal chart shows the latest 250 data with the COT3 signals.

The following signal chart shows the latest 250 data with the COT4 signals.

Commentary
The signals on USDEUR are mostly neutral and no directional bias in the horizon.
CHF Currency
Signals from the CHF currency can be used to understand the expected directional bias of the USDCHF pair or any other CHF pair.
The following signal chart shows the latest 250 data with the COT1 signals.
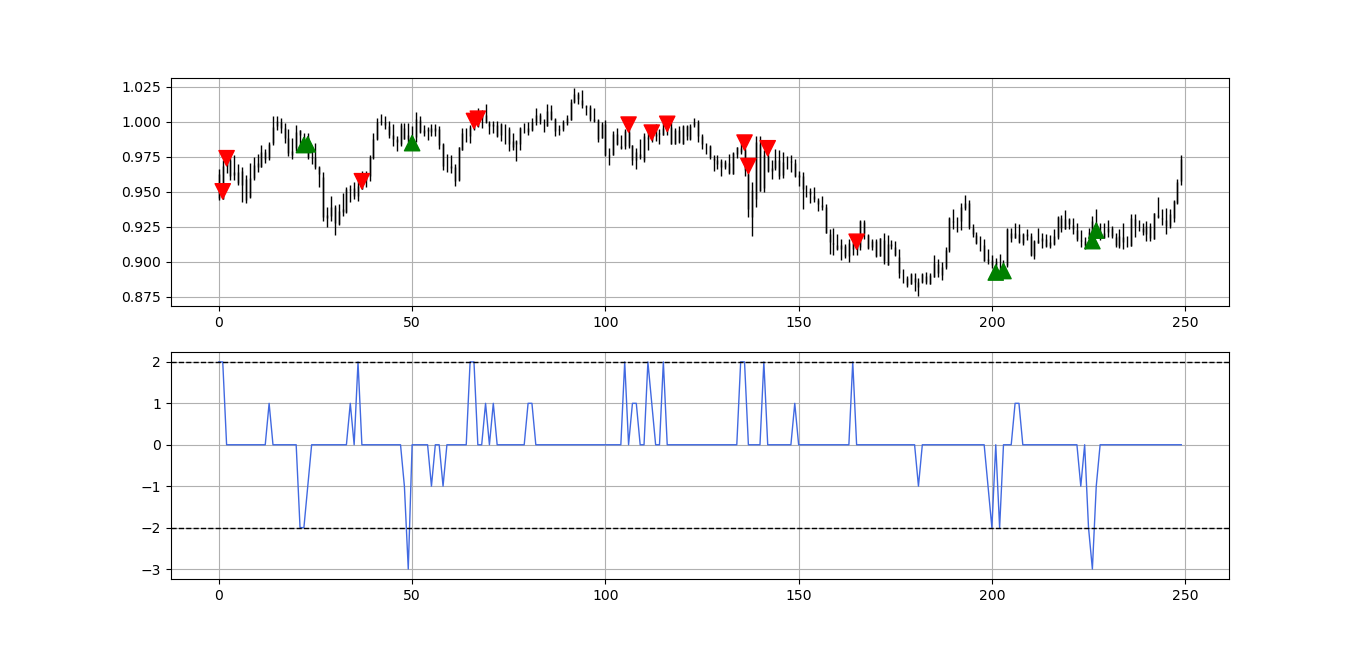
The blue indicator in the second panel is the representation of positioning (and sentiment) with the barriers at 2 and -2.
The following signal chart shows the latest 250 data with the COT2 signals.

The following signal chart shows the latest 250 data with the COT3 signals.

The following signal chart shows the latest 250 data with the COT4 signals.

Commentary
The signals on USDCHF are mostly neutral with a slight bullish bias from two signals given two weeks ago by COT2 and COT3 which still have upside potential.
GBP Currency
Signals from the GBP currency can be used to understand the expected directional bias of the USDGBP pair or any other GBP pair.
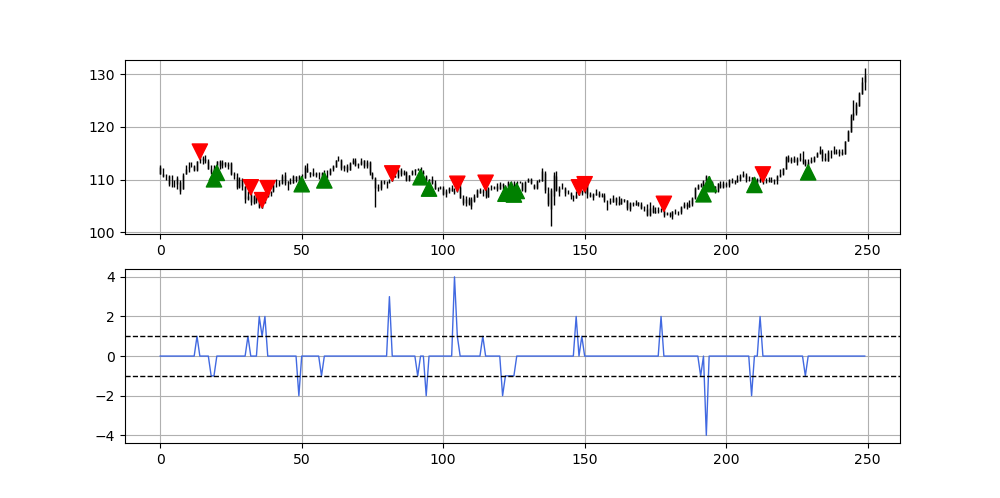
The following signal chart shows the latest 250 data with the COT1 signals.

The following signal chart shows the latest 250 data with the COT2 signals.

The following signal chart shows the latest 250 data with the COT3 signals.

A cluster of signals enhances the conviction.
The following signal chart shows the latest 250 data with the COT4 signals.

Commentary
The signals on USDGBP are mostly neutral and no directional bias in the horizon.
JPY Currency
Signals from the JPY currency can be used to understand the expected directional bias of the USDJPY pair or any other JPY pair.
The following signal chart shows the latest 250 data with the COT1 signals.

USDJPY has more signals in the COT1 strategy than the others because its model is slightly different than the others (which are homogeneous).
The following signal chart shows the latest 250 data with the COT2 signals.

The following signal chart shows the latest 250 data with the COT3 signals.

It may happen that from time to time, no sentiment signal occurs for a long time.
The following signal chart shows the latest 250 data with the COT4 signals.
Commentary
The signals on USDJPY are mostly neutral and no directional bias in the horizon.
CAD Currency
Signals from the CAD currency can be used to understand the expected directional bias of the USDCAD pair or any other CAD pair.
The following signal chart shows the latest 250 data with the COT1 signals.
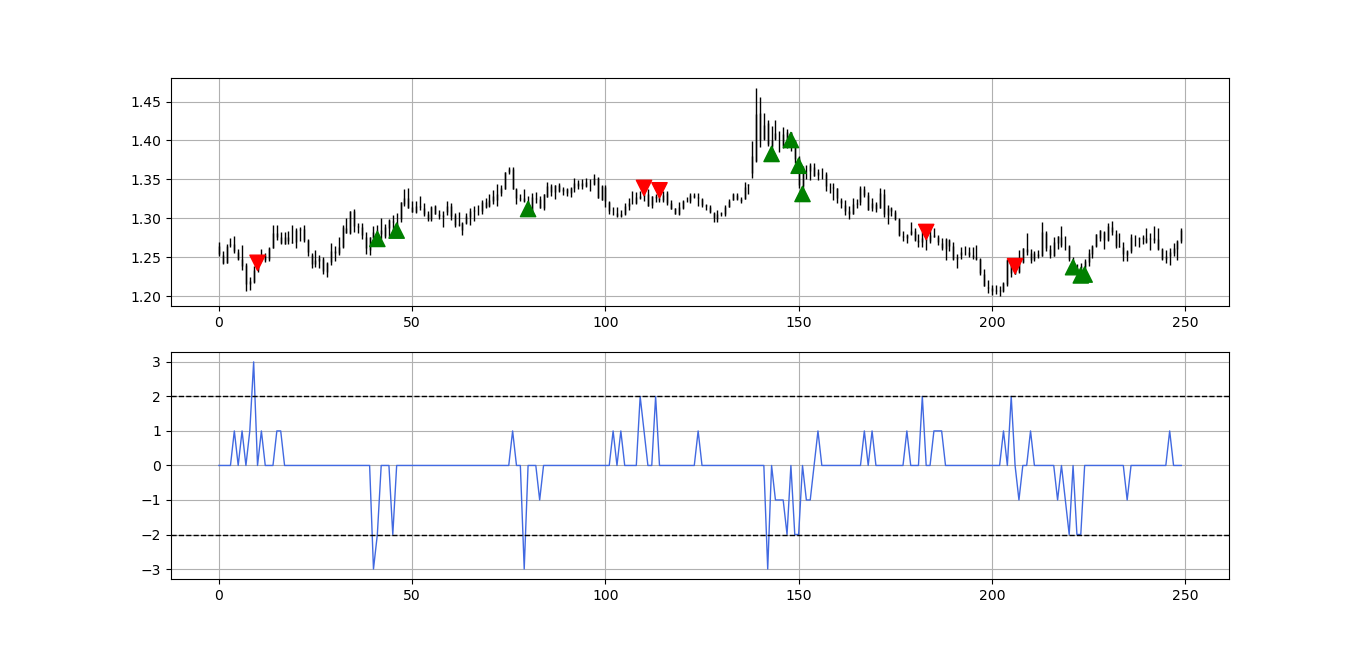
The following signal chart shows the latest 250 data with the COT2 signals.

The following signal chart shows the latest 250 data with the COT3 signals.

Sentiment signals must not be used as trade recommendations or investment solicitations.
The following signal chart shows the latest 250 data with the COT4 signals.

Commentary
The signals on USDCAD are mostly neutral and no directional bias in the horizon. The last signal was bullish given around the last local bottom but it has already reached its potential.
Interesting Cross Ideas
A cross is a currency pair without the USD. An example of this would be EURCAD. The interesting part comes with the fact of the double conviction event which is having a bullish signal on the base currency and a bearish signal on the price currency.
There are no interesting cross plays for this week. If an opportunity presents itself, the details would be given in this section.
Historical Track Record
As a reminder, the next table shows the historical non-binding track record of the model using the specific back-testing rules described in the introductory post.
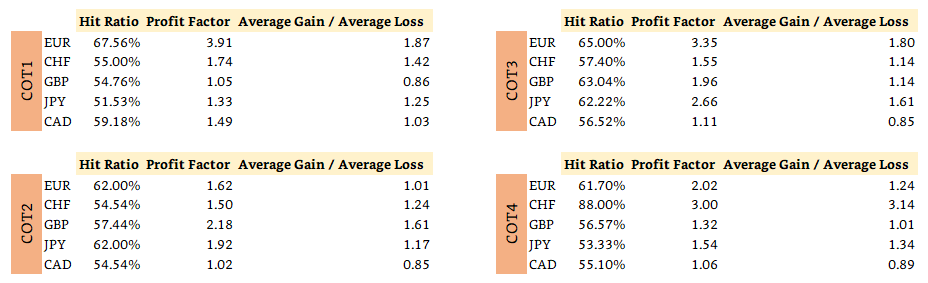
Past results are not representative of future results.

2. The Chaos Impact Index
The Chaos Impact Index is a calculation based on many variables from different areas such as opinions, volatility, momentum, short-term flows, and psychological factors. Its name comes from the fact that it tries to find hidden patterns within the chaos of the elements it is comprised of.
The Chaos Impact Index is calculated on a daily basis but is part of a weekly document and therefore, if a signal occurs during the week, an email and a post would be sent with the market expectations post-signal. The index is presented as a binary event where it shows the market sentiment:
Whenever the market sentiment is bullish, the market is shown in green.
Whenever the market sentiment is bearish, the market is shown in red.
EUR Currency
The following signal chart shows the latest 250 data with the signals.
