


Drop Everything - This is the Best Way to Use the RSI
Presenting my Hidden Secret of the RSI - The Double Conservative Confirmation


We all have our favorite ways of using certain techniques. Some traders like following the trend with simple moving averages while others like to look for price action breakouts. This article presents one of my preferred ways to look at the RSI, or should I say RSI’s?
The RSI in a Nutshell
The relative strength index (RSI), developed by J. Welles Wilder Jr. in 1978, is a momentum oscillator designed to measure the speed and magnitude of recent price changes. It captures whether a security is overbought or oversold, providing insight into potential reversal zones or confirmation of trends. Unlike the MACD, which is unbounded and centered around zero, RSI is bounded between 0 and 100, which makes it ideal for identifying extremes in price movement.
The RSI’s core concept is simple: compare average gains to average losses over a specified lookback period, usually 14 periods. If prices have mostly risen during that period, the RSI moves toward 100; if they’ve mostly fallen, the RSI approaches 0.
To construct the RSI, we begin with the basic notion of relative strength — not in a physical sense, but the ratio of bullish to bearish movement in price. Given a series of closing prices P, we compute the price change:

This change is decomposed into two parts:
The upward move (gain).
The downward move (loss).
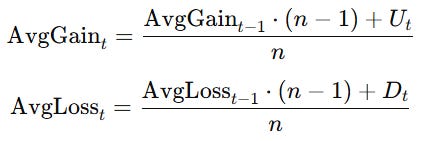
These values are then smoothed, not simply averaged. Wilder used a type of exponential smoothing in his original formulation, which is a recursive formula similar to EMA:
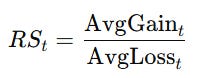
With these averages, we define the relative strength (RS):
Finally, the RSI itself is calculated by normalizing RS into a 0–100 range:

This formulation ensures that when gains dominate, RS > 1 and RSI moves toward 100; when losses dominate, RS < 1 and RSI falls toward 0.

The RSI is traditionally used to identify overbought or oversold conditions. The key levels are:
RSI > 70: asset may be overbought.
RSI < 30: asset may be oversold.
However, interpreting RSI requires more than just these thresholds.
First, let’s consider what "overbought" and "oversold" truly mean. Overbought does not mean the price will immediately fall — it means the price has risen strongly, and a correction could be near. Likewise, oversold means a strong decline has occurred, not that a rebound is guaranteed.
In strong trends, RSI can stay overbought or oversold for long periods. This is where RSI becomes more useful in confirming momentum rather than calling reversals. For example, if RSI remains above 70 during an uptrend, it confirms strength — not necessarily a reason to sell.
K’s Double Conservative Confirmation Technique
As many of you know, K’s indicators are a selection of my favorite custom-made technical indicators. They can either be trend following, reversal, or even volatility-based. The main goal is that they satisfy certain predictive requirements. The latest addition to this collection is K’s Double Conservative Confirmation (DCC).
DCC relies on a simple combination of two different RSI’s, a 13-period RSI and a 34-period RSI. The conservative part comes from the way we use them:
Keep reading with a 7-day free trial
Subscribe to All About Trading! to keep reading this post and get 7 days of free access to the full post archives.