


Downloading Cryptocurrencies Historical Data in Python
A Quick Way of Importing Historical Cryptocurrency Data in Python


Historical data is needed to be able to do research and perform back-tests and therefore a nice and clean way of importing it becomes essential. This article discusses a way of quickly importing cryptocurrency data from Binance using Python.
If you are interested by trend following indicators and strategies then my book could interest you. It features advanced trend-following indicators and strategies with a GitHub page dedicated to the continuously updated code. Also, this book features the original colors after having optimized for printing costs. If you feel that this interests you, feel free to visit the below Amazon link, or if you prefer to buy the PDF version, you could contact me on LinkedIn.
Trend Following Strategies in Python: How to Use Indicators to Follow the Trend.
Amazon.com: Trend Following Strategies in Python: How to Use Indicators to Follow the Trend.: 9798756939620: Kaabar…www.amazon.com
Importing Cryptocurrency Data
Importing data requires requesting said data from a third party provider. We can do this in Python in many ways. Up until now, we have seen how to do this using a MT5 API. For cryptocurrency data, it may be better to use Binance. For starters, we have to import the needed libraries as follows.
import requests
import json
import pandas as pd
import numpy as np
import datetime as dt
Next, we select our preferred time frame in a variable we call frequency.
frequency = '1h'Finally, the below function can be used to import the necessary cryptocurrency as we will see later.
def import_crypto(symbol, interval = frequency):

    # Getting the original link from Binance
    url = 'https://api.binance.com/api/v1/klines'

    # Linking the link with the Cryptocurrency and the time frame
    link = url + '?symbol=' + symbol + '&interval=' + interval

    # Requesting the data in the form of text
    data = json.loads(requests.get(link).text)

    # Converting the text data to dataframe
    data = np.array(data)
    data = data.astype(np.float)
    data = data[:, 1:5]

    return data
To import the currency on the hourly time frame, we simply have to call the function with the right name and store it in a variable (by default, it will be an array).
my_data = import_crypto('BTCUSDT')As is implied, BTCUSDT is the value of Bitcoin relative to Tether (the greenback’s proxy in the crypto world). For example, if we wanted to import Cardano’s historical data, we would use ADAUSDT.
Plotting the Data Using Candlesticks
After importing the data, it is useful to visualize it through complete charts. One of these complete charts are candlesticks. Suppose we have the array called my_data that we imported earlier. We can define the following function that will allow us to chart it.
import matplotlib.pyplot as plt

def ohlc_plot_candles(data, window):

    sample = data[-window:, ]

    for i in range(len(sample)):

        plt.vlines(x = i, ymin = sample[i, 2], ymax = sample[i, 1], color = 'black', linewidth = 1)

        if sample[i, 3] > sample[i, 0]:

            plt.vlines(x = i, ymin = sample[i, 0], ymax = sample[i, 3], color = 'green', linewidth = 3)

        if sample[i, 3] < sample[i, 0]:

            plt.vlines(x = i, ymin = sample[i, 3], ymax = sample[i, 0], color = 'red', linewidth = 3)

        if sample[i, 3] == sample[i, 0]:

            plt.vlines(x = i, ymin = sample[i, 3], ymax = sample[i, 0] + 0.00001, color = 'black', linewidth = 1.75)

    plt.grid()
Now, we call it as follows.
ohlc_plot_candles(my_data, 250)The result is the following chart.
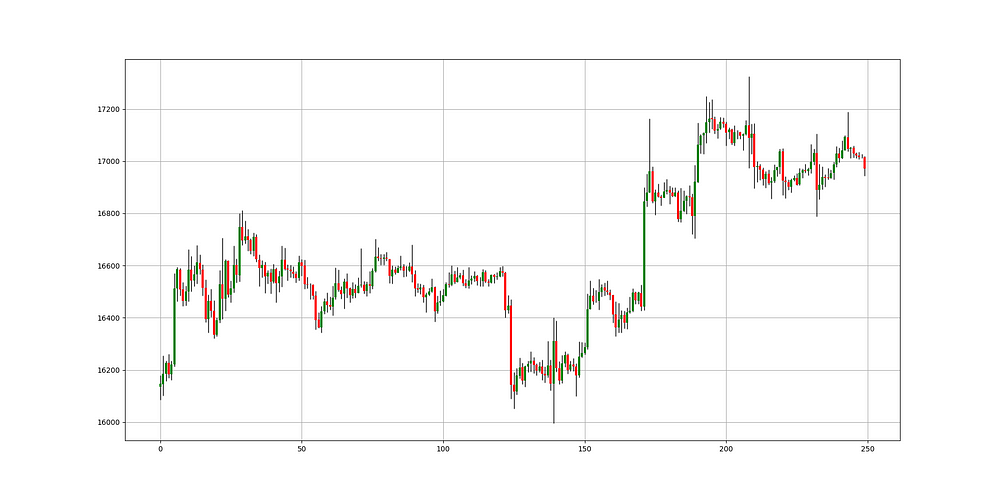
As you can see, not much is needed to achieve a historical import and complex charting.
If you want to see how to create all sorts of algorithms yourself, feel free to check out Lumiwealth. From algorithmic trading to blockchain and machine learning, they have hands-on detailed courses that I highly recommend.
Learn Algorithmic Trading with Python Lumiwealth
Learn how to create your own trading algorithms for stocks, options, crypto and more from the experts at Lumiwealth. Click to learn more
Summary
To sum up, what I am trying to do is to simply contribute to the world of objective technical analysis which is promoting more transparent techniques and strategies that need to be back-tested before being implemented. This way, technical analysis will get rid of the bad reputation of being subjective and scientifically unfounded.
I recommend you always follow the the below steps whenever you come across a trading technique or strategy:
Have a critical mindset and get rid of any emotions.
Back-test it using real life simulation and conditions.
If you find potential, try optimizing it and running a forward test.
Always include transaction costs and any slippage simulation in your tests.
Always include risk management and position sizing in your tests.
Finally, even after making sure of the above, stay careful and monitor the strategy because market dynamics may shift and make the strategy unprofitable.