Developing a New Technical Indicator
A New Technical Indicator Alert
Custom technical indicators are simple calculations we often use to look at the market from a different angle. Generally speaking, technical analysts are used to use the RSI and moving averages as they are classic indicators that have already proven their worth. However, it is always interesting to venture outside our comfort zone.
This article presents a simple idea of a technical indicator and how to use it, but also how to code it in TradingView.
K’s Reversal Accelerator
The idea of this indicator is simple; it’s all about counting the number of bullish candlesticks within a rolling window divided by the number of the candlesticks within the same window. This will give a naturally bounded indicator within 0 and 100% (with 100% being an all bullish candlestick territory).
The default rolling window is 30. Thus, if the last 30 candlesticks are bearish (the close price is less than the open price), then the indicator will be equal to 0%.
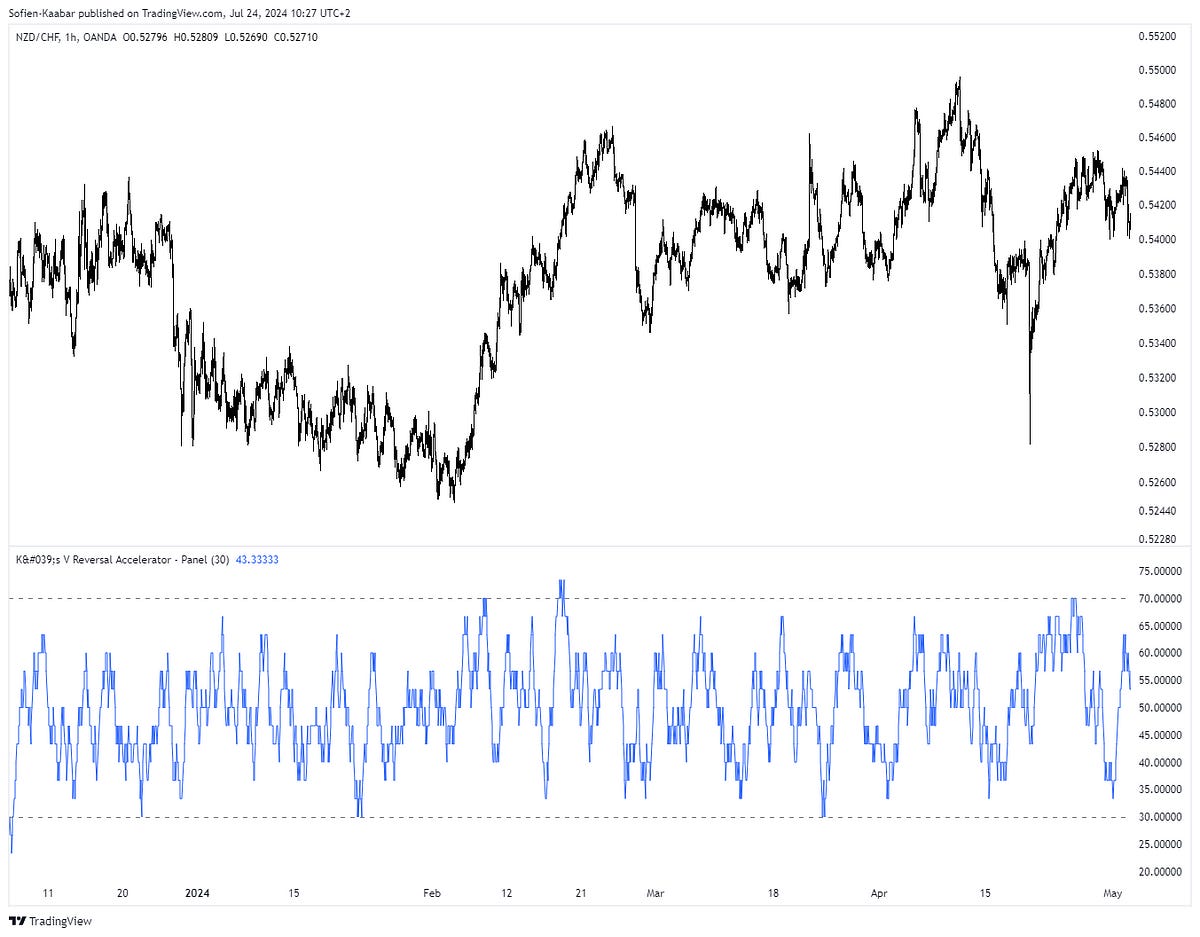
Take a look at the following chart.
You can see that the indicator seems to fluctuate between 0 and 100 with 70 and 30 as practical boundaries (remember these from the RSI’s default barriers).
If you want to see more of my work, you can visit my website for the books catalogue by simply following this link:
Coding the Indicator and How to Use it
The indicator can be coded using the following code:
//@version=5
indicator("K's V Reversal Accelerator - Panel", overlay = false)

// Input for the length of the rolling window
rolling_window_length = input.int(30, minval = 1, title = "Rolling Window Length")

// Define a bullish candlestick: close > open
is_bullish = close > open

// Calculate the rolling count of bullish candlesticks
bullish_count = math.sum(is_bullish ? 1 : 0, rolling_window_length)

// Calculate the percentage of bullish candlesticks
bullish_percentage = bullish_count * 100 / rolling_window_length

plot(bullish_percentage)
hline(30)
hline(70)
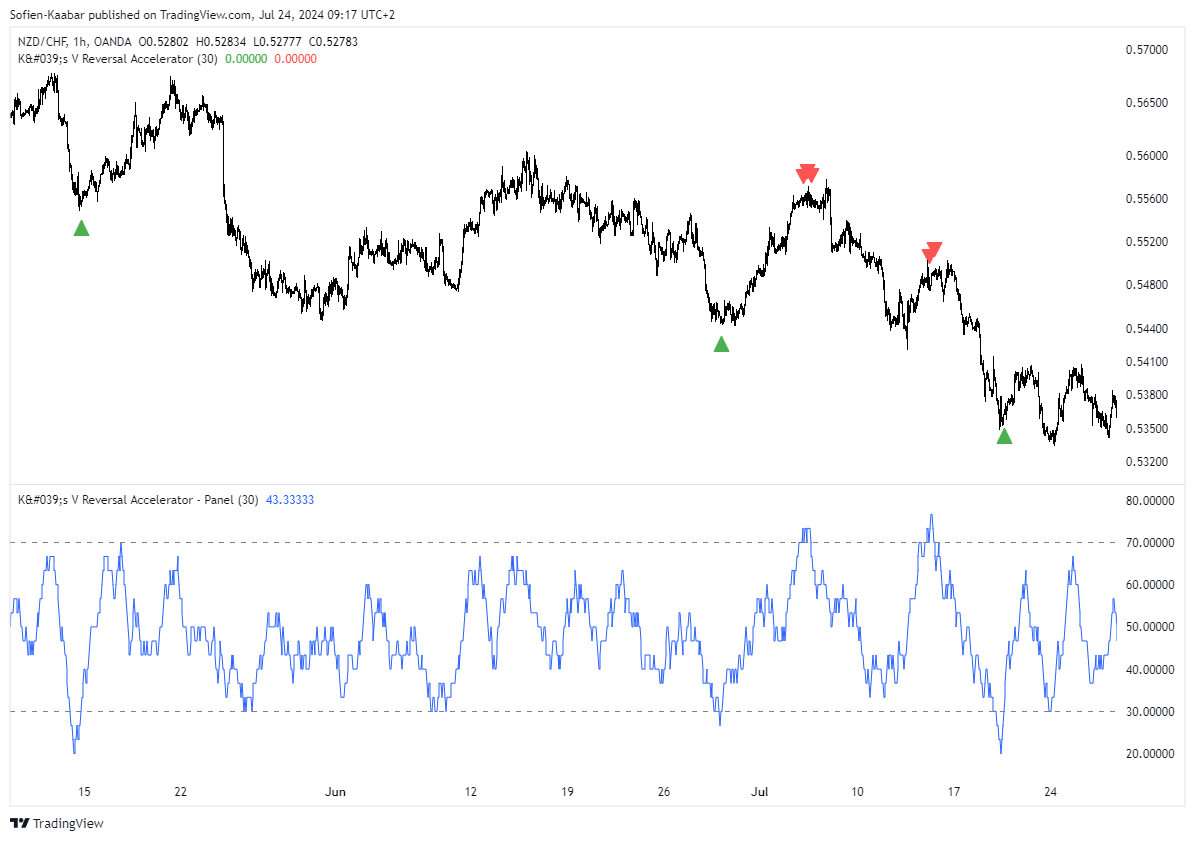
The way we can use this indicator is by using the re-integration method which is when the indicator surpasses the oversold level (30) after being below it or when the indicator breaks the overbought level (70) after being above it.
Take a look at the following signal chart.
A default technique to use this indicator can be as follows:
A bullish signal is generated whenever the indicator surpasses 30 but remains below 40.
A bearish signal is generated whenever the indicator breaks 70 but remains above 60.
Use the following code to get the signals from the technique:
//@version=5
indicator("K's V Reversal Accelerator", overlay = true)

// Input for the length of the rolling window
rolling_window_length = input.int(30, minval = 1, title = "Rolling Window Length")

// Define a bullish candlestick: close > open
is_bullish = close > open

// Calculate the rolling count of bullish candlesticks
bullish_count = math.sum(is_bullish ? 1 : 0, rolling_window_length)

// Calculate the percentage of bullish candlesticks
bullish_percentage = bullish_count * 100 / rolling_window_length

buy_signal  = bullish_percentage >= 30 and bullish_percentage < 40 and bullish_percentage[1] < 30
sell_signal = bullish_percentage <= 70 and bullish_percentage > 60 and bullish_percentage[1] > 70

plotshape(buy_signal,  style = shape.triangleup,   color = color.green,  location =  location.belowbar, size = size.small)
plotshape(sell_signal,  style = shape.triangledown, color = color.red,    location =  location.abovebar, size = size.small)
The following chart shows more signals generated by the indicator.
There you have it, a light indicator with no complications. But you must also understand that all technical indicators have limits and the true success will come from you and your mindset and not just a simple mathematical formula with no awareness of the current market regime and its fundamentals.
You can also check out my other newsletter The Weekly Market Sentiment Report that sends weekly directional views every weekend to highlight the important trading opportunities using a mix between sentiment analysis (COT report, put-call ratio, etc.) and rules-based technical analysis.
If you liked this article, do not hesitate to like and comment, to further the discussion!


