Detecting Market Regime With the Vertical Horizontal Filter
Detecting Market Regime Changes in Python
A huge chunk of the time spent trading is spent searching for the the answer to this famous question: “What will the market do next? Range? Trend?”. The answer to this question is a form of holy grail because if we know what will happen then we will be able to choose the right strategy.
Many good strategies fail at some point because the market regime has switched and is no longer representative. Imagine a hypothetical scenario where we know the market will continue to move sideways. A strategy relying on buying the dips and selling the highs should do well, however, the moment the market decides to go in one direction, the strategy will underperform.
I have just released a new book after the success of the previous book. It features advanced trend following indicators and strategies with a GitHub page dedicated to the continuously updated code. Also, this book features the original colors after having optimized for printing costs. If you feel that this interests you, feel free to visit the below Amazon link, or if you prefer to buy the PDF version, you could contact me on LinkedIn.
What is Market Regime?
Markets generally trend or move sideways. We must apply our strategies in the right timing, meaning that mean-reversion strategies should be applied in markets that are moving sideways while trend-following strategies should be applied in markets that are going up or down. This is to maximize the chances of profitability.
For example, a bullish market has more chance to continue to go up than down and therefore, trend-following strategies should outperform because they are backed by the probability of going up. In contrast, mean-reversion strategies should underperform because they will keep giving bearish signals while the market continues to go up.
A reminder: Bullish designates a market that is trending up while bearish designates a market that is trending down.
Our job with the Vertical Horizontal Filter is to try to detect the current market state and to see if we can anticipate its end. By this we can say whether the current trend is about to end or whether the current range is about to trend.
Creating the Vertical Horizontal Filter
The Vertical Horizontal Filter was introduced by Adam White and is a measure how strong or weak the markets are trending. This is to be able to choose the appropriate strategy. It is calculated using the following steps:
Calculate the absolute sum of price differences from one period to another. For example, if the current price is $99 and the last price was $100, then the absolute price column should be $1.
Calculate the maximum values in a certain lookback period and subtract it from the minimum value. This means that if the lookback period is 5, then we should look to subtract the highest close from the lowest close in that time period.
Divide the numerator by the denominator to get the Vertical Horizontal Filter.
# The function to add a number of columns inside an array
def adder(Data, times):

    for i in range(1, times + 1):

        new_col = np.zeros((len(Data), 1), dtype = float)
        Data = np.append(Data, new_col, axis = 1)

    return Data
# The function to delete a number of columns starting from an index
def deleter(Data, index, times):
for i in range(1, times + 1):
Data = np.delete(Data, index, axis = 1)
return Data
# The function to delete a number of rows from the beginning
def jump(Data, jump):
Data = Data[jump:, ]
return Data# Example of adding 3 empty columns to an array
my_ohlc_array = adder(my_ohlc_array, 3)# Example of deleting the 2 columns after the column indexed at 3
my_ohlc_array = deleter(my_ohlc_array, 3, 2)# Example of deleting the first 20 rows
my_ohlc_array = jump(my_ohlc_array, 20)# Remember, OHLC is an abbreviation of Open, High, Low, and Close and it refers to the standard historical data fileAnd now, we can go through by using the below function to create the Vertical Horizontal Filter.
def vertical_horizontal_indicator(Data, lookback, what, where):

    # Adding a few columns
    Data = adder(Data, 10)

    for i in range(len(Data)):

        Data[i, where] = Data[i, what] - Data[i - 1, what]

    Data = jump(Data, 1)

    Data[:, where] = abs(Data[:, where])for i in range(len(Data)):

        Data[i, where + 1] = Data[i - lookback + 1:i + 1, where].sum()

    for i in range(len(Data)):

        try:

            Data[i, where + 2] = max(Data[i - lookback + 1:i + 1, what]) - min(Data[i - lookback + 1:i + 1, what])

        except ValueError:

            pass

    Data = jump(Data, lookback)

    Data[:, where + 3] = Data[:, where + 2] / Data[:, where + 1]

    Data = deleter(Data, where, 3)

    return Data
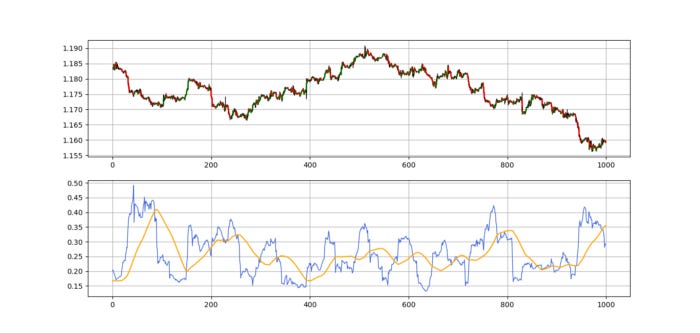
The issue however is that it is not really used for trading nor is it clear how it is used to follow the trend. The idea of the indicator is that rising values represent a trending market (Bullish or bearish) while falling values represent a ranging market, but we need to find our own thresholds and limits.
The above chart shows the hourly EURUSD with the 60-period Vertical Horizontal Filter. On average, we can notice that rising values of the indicator correspond to a trending market and therefore, we can probably form a type of mean that follows the indicator’s values and derive hypothetical interpretations from the cross such as the below:
Whenever the indicator is below its moving average, the market’s regime is unclear / ranging.
Whenever the indicator is above its moving average, the market’s regime is trending.

The above chart features the addition of a 60-period moving average. If we want to apply the conditions stated before, we can create the following signal function that inputs 1’s in a separate column for trending markets.
def signal(Data, indicator, indicator_ma, signal):

    Data = adder(Data, 10)

    for i in range(len(Data)):

        if Data[i, indicator] > Data[i, indicator_ma]:

            Data[i, signal] = 1

return DataOne Last Word
I have recently started an NFT collection that aims to support different humanitarian and medical causes. The Society of Light is a set of limited collectibles which will help make the world slightly better as each sale will see a percentage of it sent directly to the charity attributed to the avatar. As I always say, nothing better than a bullet list to outline the benefits of buying these NFT’s:
High-potential gain: By concentrating the remaining sales proceedings on marketing and promoting The Society of Light, I am aiming to maximize their value as much as possible in the secondary market. Remember that trading in the secondary market also means that a portion of royalties will be donated to the same charity.
Art collection and portfolio diversification: Having a collection of avatars that symbolize good deeds is truly satisfying. Investing does not need to only have selfish needs even though there is nothing wrong with investing to make money. But what about investing to make money, help others, and collect art?
Donating to your preferred cause(s): This is a flexible way of allocating different funds to your charities.
A free copy of my book in PDF: Any buyer of any NFT will receive a free copy of my latest book shown in the link of the article.


