Detecting Market Gaps in Python.
Introducing Gaps and How to Identify and Trade Them.
Gaps form an important part of price action. They vary in rareness from market to market. For instance, in the currencies market, they usually happen on opening following the weekend or whenever there is a big announcement while in stocks, gaps are fairly common from one day to another. In this article, we will see the different types of gaps and then code a scanner in Python that finds them and applies the well-known practice of “filling the gaps” as an algorithmic trading strategy.
I have just released a new book after the success of the previous book. It features advanced trend following indicators and strategies with a GitHub page dedicated to the continuously updated code. Also, this book features the original colors after having optimized for printing costs. If you feel that this interests you, feel free to visit the below Amazon link, or if you prefer to buy the PDF version, you could contact me on LinkedIn.
Introduction to Gaps
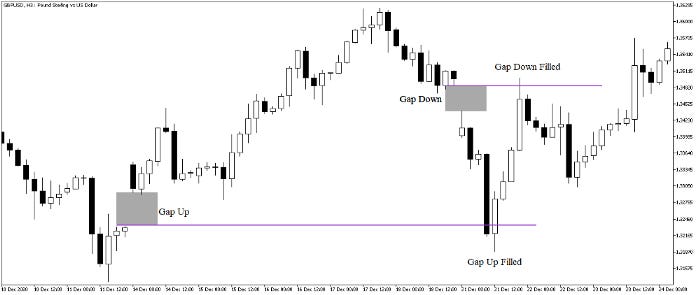
A gap is a discontinuation or a hole between prices. When a market is trading at $100 and suddenly trades at $102 without ever quoting at $101, it has formed a gap. This can be seen in the charts where it appears to have a missing piece between candlesticks. Take a look at the below chart on the GBPUSD and notice the empty space in grey between candlesticks.
Gaps can occur due to fundamental and technical reasons, but we are mostly interested in identifying and trading them. In the currencies market, the visible gaps are the ones that occur during the weekend. Since it is traded all day long for 5 days a week, the presumed gaps would probably look like giant candles, but since we cannot know for sure, we will stick to the common definition of gaps.
“We call the act of trading based on gaps: Playing the gap.”
There are different types of gaps and distinguishing them can be quite tricky:
A common gap: It generally occurs in a sideways markets. It is likely to be filled because of the market’s mean-reversion dynamic.
A breakaway gap: It generally resembles a common gap but the gap occurs above a graphical resistance or below a graphical support. It signals acceleration in the new trend.
A runaway gap: It generally occurs within the trend but it confirms it more, therefore, it is a continuation pattern.
An exhaustion gap: It generally occurs at the end of a trend and close to a support or resistance level. It is a reversal pattern.
Note that most of the above specificities come from personal experience as some sources state that common gaps are least likely to be filled. Also, the runaway and exhaustion gaps are so similar that it is almost impossible to know which is which at the moment they appear, therefore, they suffer from hindsight bias.
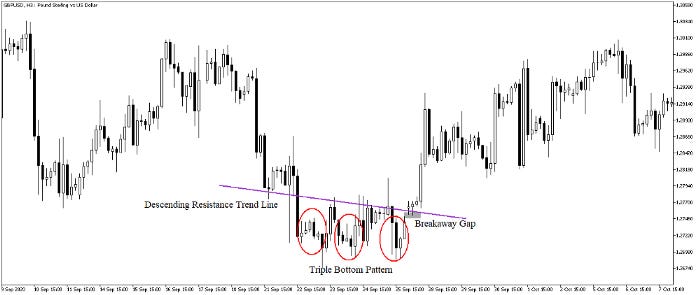
The above chart shows a chart on GBPUSD with a breakaway gap after a triple bottom bullish reversal pattern following the surpass of its resistance. This gives credit that the move will likely continue higher.
In this article, we will be considering that all gaps should be filled and therefore, all gaps encountered by the algorithm coded below are common gaps. Many explanations can be used to explain why gaps are filled:
An overly optimistic or pessimistic gap reaction which makes participants go in the other direction to fade this gap. This is also called Irrational Exuberance, a term first coined by Alan Greenspan.
The gap occurs around a support or resistance level forcing it to reverse course.
Creating a Gap Scanner
Just as we detect common gaps with our eyes, we can code a recursive algorithm that does the same thing for us. Let us consider that we will work on Hourly data since 2010. What variables can we use to populate the scanner function? I would say the width variable is the most important one.
The width: This is your threshold where you would say for certain that there is a gap. On hourly FX data, we cannot really say that 1 or 2 pips are worthy of a gap. Therefore, we can consider that at least a 5 pips gap is worthy of being traded. Taking into account a 0.2 spread, an example of maximum profit on EURUSD would be 5–0.2 = 4.8 pips which is $4.8 on a mini lot account with 1:100 leverage. I say maximum profit because our target on the gap trade is to fill it. This means that if the gap is 5 pips wide, and we trade directly based on it, we can expect 4.8 pips gain after accounting for the spread.
Let us take a look at the scanner function below:
width = 0.0005 # 5 pips Gap example for Hourly OHLC data
def signal(Data, opening, close, width, buy, sell):
for i in range(len(Data)):
if Data[i, opening] < Data[i - 1, close] and abs(Data[i, opening] - Data[i - 1, close]) >= width:
Data[i, buy] = 1
if Data[i, opening] > Data[i - 1, close] and abs(Data[i, opening] - Data[i - 1, close]) >= width:
Data[i, sell] = -1
return DataThe signal function takes into account 4 variables:
The Data variable is the OHLC time series in the form of an array, preferably a numpy array.
The closing variable is the column that holds the closing price (The C in OHLC).
The opening variable is the column that holds the opening price (The O in OHLC).
The width is the distance between the closing price and the new opening price that has just opened. This measures the minimum distance for the gap to be considered worthy for a trade.
The buy and sell variables are the columns where the buy and sell orders are put. A value of 1 refers to a buying trigger while a value of -1 refers to a selling trigger.
If you are also interested by more technical indicators and strategies, then my book might interest you:
It is time to back-test the strategy for informational purposes and to see where does pure gap trading stands with regards to predictability. The trading rules are therefore:
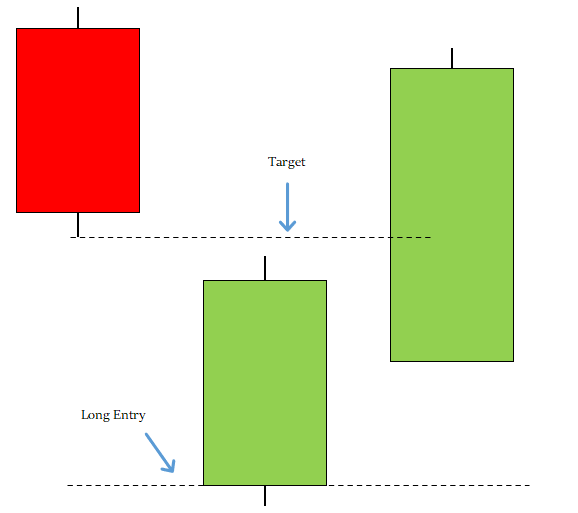
Go long (Buy) whenever the scanner identifies a bullish gap configuration. A bullish gap is a gap down looking to be filled upwards when the market’s high reaches the low of the candle before the gap.
Go short (Sell) whenever the scanner identifies a bearish gap configuration. A bearish gap is a gap up looking to be filled downwards when the market’s low reaches the high of the candle before the gap.
The trade is opened and closed either at fill or stopped at the next signal.
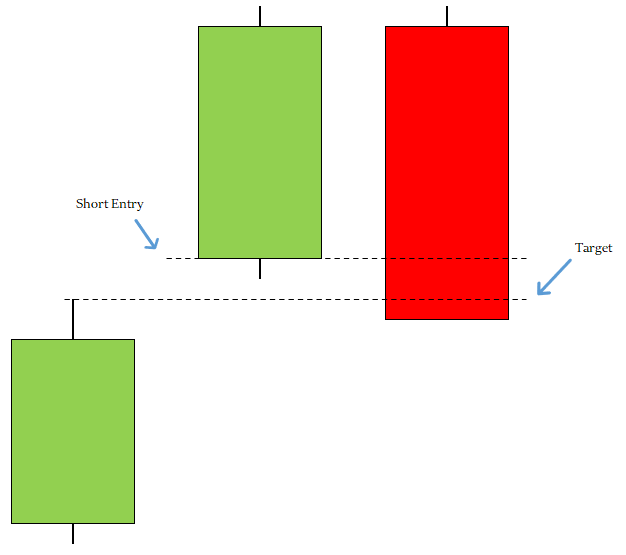
The above illustration shows an example of a gap that needs to be filled through a short sell trade, therefore, we will sell at the opening above the previous closing price and target its high.
The above illustration shows an example of a gap that needs to be filled through a long trade, therefore, we will buy at the opening below the previous closing price and target its low.
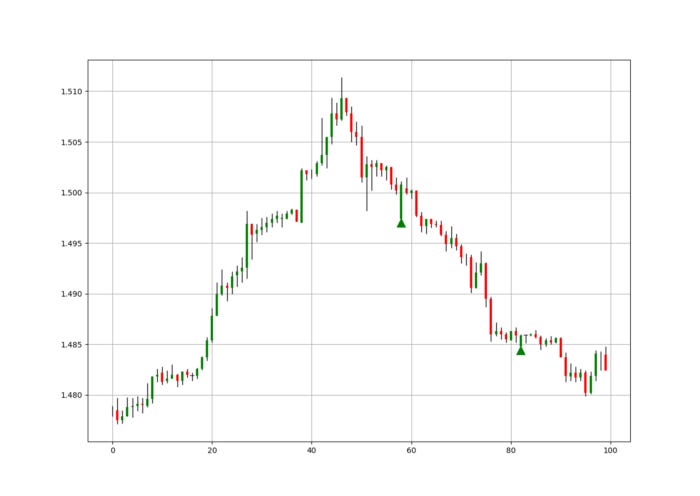
These charts show a back-test using the conditions above. The rules are tilted towards a high ratio and this is because the stop we set is simply closing out when we find another gap in the opposite sense while the target is filling the gap. Thus, theoretically, we must have a high hit ratio.
def signal_quality(Data, buy, sell, where):

    for i in range(len(Data)):

        try:

            if Data[i, buy] == 1:

                for a in range(i, len(Data)):

                    if Data[a, 1] >= Data[i - 1, 2]:

                        Data[a, where] = Data[i - 1, 2] - Data[i, 0]
                        break

                    elif Data[a, sell] == -1:

                        Data[a, where] = Data[a, 0] - Data[i, 0]
                        break

            elif Data[i, sell] == -1:

                for a in range(i, len(Data)):

                    if Data[a, 2] <= Data[i - 1, 1]:

                        Data[a, where] = Data[i, 0] - Data[i - 1, 1]
                        break

                    elif Data[a, buy] == 1:

                        Data[a, where] = Data[i, 0] - Data[a, 0]
                        break

        except IndexError:

             pass

return Data# Applying the Signal Quality Function
my_data = signal_quality(my_data, 6, 7, 8)positives = my_data[my_data[:, 8] > 0]
negatives = my_data[my_data[:, 8] < 0]# Calculating Signal Quality
signal_quality = len(positives) / (len(negatives) + len(positives))print('Signal Quality = ', round(signal_quality * 100, 2), '%')Some markets exhibit more gaps than others and this can be exploited by creating more complex strategies on them using gaps.
# Output EURUSD Hourly Data = 77.89%
# Output USDCHF Hourly Data = 76.13%
# Output GBPUSD Hourly Data = 70.13%
# Output AUDUSD Hourly Data = 77.80%
Be aware that the above signal quality metrics do not suggest that the gap trading strategy is extremely profitable. Remember, the function is biased towards a high hit ratio and also transaction costs are not taken into account, therefore, they are only for illustration purposes but it is interesting to see that they have potential.
Remember to always do your back-tests. You should always believe that other people are wrong. My indicators and style of trading may work for me but maybe not for you.
I am a firm believer of not spoon-feeding. I have learnt by doing and not by copying. You should get the idea, the function, the intuition, the conditions of the strategy, and then elaborate (an even better) one yourself so that you back-test and improve it before deciding to take it live or to eliminate it. My choice of not providing specific Back-testing results should lead the reader to explore more herself the strategy and work on it more.
One Last Word
I have recently started an NFT collection that aims to support different humanitarian and medical causes. The Society of Light is a set of limited collectibles which will help make the world slightly better as each sale will see a percentage of it sent directly to the charity attributed to the avatar. As I always say, nothing better than a bullet list to outline the benefits of buying these NFT’s:
High-potential gain: By concentrating the remaining sales proceedings on marketing and promoting The Society of Light, I am aiming to maximize their value as much as possible in the secondary market. Remember that trading in the secondary market also means that a portion of royalties will be donated to the same charity.
Art collection and portfolio diversification: Having a collection of avatars that symbolize good deeds is truly satisfying. Investing does not need to only have selfish needs even though there is nothing wrong with investing to make money. But what about investing to make money, help others, and collect art?
Donating to your preferred cause(s): This is a flexible way of allocating different funds to your charities.
A free copy of my book in PDF: Any buyer of any NFT will receive a free copy of my latest book shown in the link of the article.


