
Detecting Market Direction & State Using the Global Moving Average Scanner in Python.
Creating the Global Moving Average Scanner in Python to Determine Market State.


Detecting the market state is a primordial step in choosing a long or short bias. Most of the time we subjectively say that a market is bullish or bearish but there are many ways to understand more the current state and one of thoses ways are moving averages, especially when grouped together. This article will discuss creating a Global index that will harbor many moving averages to decipher the trend.
I have just published a new book after the success of my previous one “New Technical Indicators in Python”. It features a more complete description and addition of structured trading strategies with a GitHub page dedicated to the continuously updated code. If you feel that this interests you, feel free to visit the below link, or if you prefer to buy the PDF version, you could contact me on LinkedIn.
The Concept of Moving Averages
Moving averages help us confirm and ride the trend. They are the most known technical indicator and this is because of their simplicity and their proven track record of adding value to the analyses. We can use them to find support and resistance levels, stops and targets, and to understand the underlying trend. This versatility makes them an indispensable tool in our trading arsenal.
As the name suggests, this is your plain simple mean that is used everywhere in statistics and basically any other part in our lives. It is simply the total values of the observations divided by the number of observations. Mathematically speaking, it can be written down as:

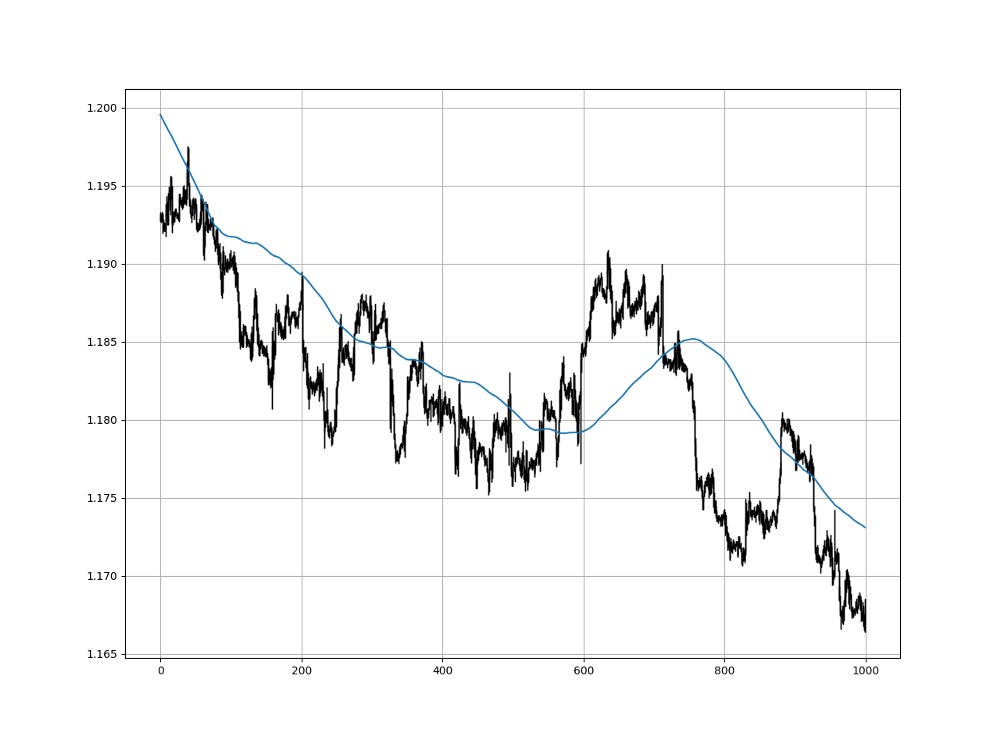
We can see that the moving average is providing decent dynamic support and resistance levels from where we can place our orders in case the market goes down there. The code for the moving average can be written down as the following:
def adder(Data, times):

    for i in range(1, times + 1):

        new = np.zeros((len(Data), 1), dtype = float)
        Data = np.append(Data, new, axis = 1)

    return Data

def deleter(Data, index, times):

    for i in range(1, times + 1):

        Data = np.delete(Data, index, axis = 1)

    return Data

def jump(Data, jump):

    Data = Data[jump:, ]

    return Data

def ma(Data, lookback, close, where):

    Data = adder(Data, 1)

    for i in range(len(Data)):

            try:
                Data[i, where] = (Data[i - lookback + 1:i + 1, close].mean())

            except IndexError:
                pass

    # Cleaning
    Data = jump(Data, lookback)

    return Data
The below states that the moving average function will be called on the array named my_data for a lookback period of 200, on the column indexed at 3 (closing prices in an OHLC array). The moving average values will then be put in the column indexed at 4 which is the one we have added using the adder function.
my_data = ma(my_data, 200, 3, 4)Creating the Global Moving Average Scanner
The Global Moving Average Scanner is simply an index composed of many moving averages. The idea is to show how many moving averages are above or below the price. A strong bullish trend will have the market price above its moving averages and a strong bearish trend will have the market price below its moving averages.
We will create a loop that calculates moving averages from 5 periods to 1000 periods with a time step of 10, meaning (5, 15, 25, 35, etc.).
# Adding one column for the GMAS
my_data = adder(my_data, 1)

# Where the first MA column will be
where = 4

# Looping around the data and creating moving averages
for i in range(5, 1000, 10):

    my_data = ma(my_data, i, 3, where)
    where = where + 1

# Cleaning the first NaN values
my_data = jump(my_data, 1000)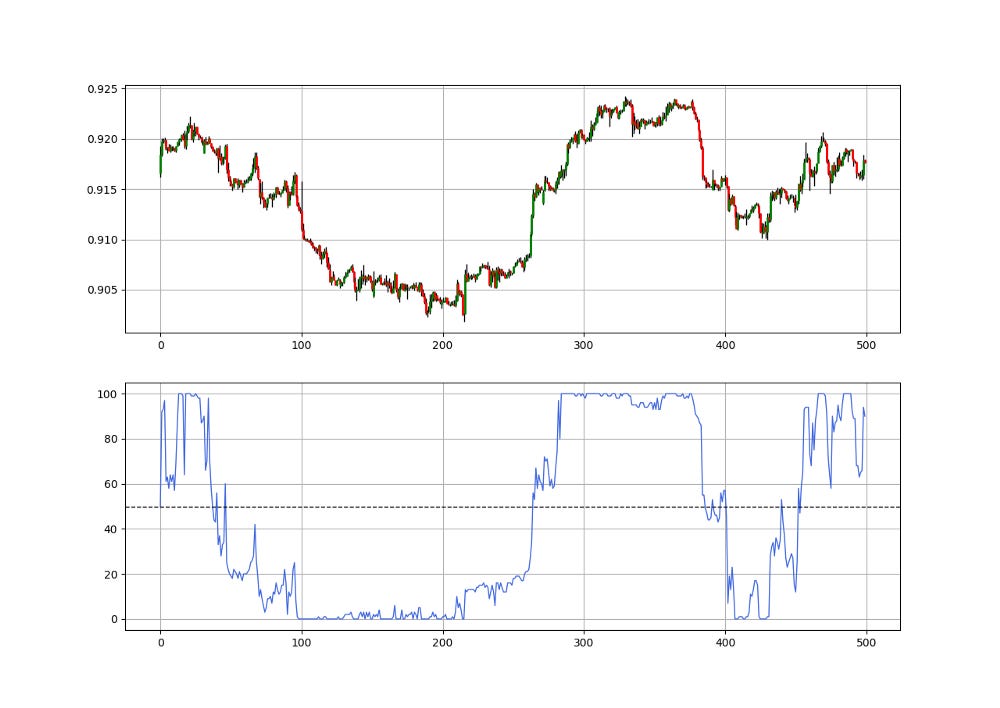
When we see a value of 67, it means that 67 moving averages out of 100 are below the market, signifying a bullish trend. As stated, this is a very simplistic indicator that is not meant for trading but rather detecting the trend’s direction and strength:
When the indicator is at 100 and sticking, this means a strong bullish trend.
When the indicator is surpassing 50, this could signal a bullish confirmation for the trend to continue higher.
When the indicator is breaking 50, the could signal a bearish confirmation for the trend to continue lower.
When the indicator is at 0 and sticking, this means a strong bearish trend.

The indicator is used in tandem with other indicators. For example, we can use a short-term RSI to follow the drop while the Global Moving Average Index is at zero or is breaking the 50 level.
Let us try something fun that will help us visually interpret it. When the indicator is above 50, we will color code the bars in green thus indicating a bullish state and when the indicator is below, we will color code the bars in red. We can use the below function to do so.
def ohlc_plot_bars(Data, window):

    Chosen = Data[-window:, ]

    for i in range(len(Chosen)):

        plt.vlines(x = i, ymin = Chosen[i, 2], ymax = Chosen[i, 1], color = 'white', linewidth = 1)
        plt.vlines(x = i, ymin = Chosen[i, 2], ymax = Chosen[i, 1], color = 'white', linewidth = 1)

        if Chosen[i, 4] > 50:
            color_chosen = 'green'
            plt.vlines(x = i, ymin = Chosen[i, 0], ymax = Chosen[i, 3], color = color_chosen, linewidth = 1.00)

        if Chosen[i, 4] < 50:
            color_chosen = 'red'
            plt.vlines(x = i, ymin = Chosen[i, 3], ymax = Chosen[i, 0], color = color_chosen, linewidth = 1.00)

        if Chosen[i, 4] == 50:
            color_chosen = 'blue'
            plt.vlines(x = i, ymin = Chosen[i, 3], ymax = Chosen[i, 0], color = color_chosen, linewidth = 1.00)

    plt.grid()
The lag is visible and as stated, it is not a trading indicator, rather it gives us a quick glance at the state. When it changes, it could signal opportunities. Notice how many times a color change results in a few bars in the same direction. This is exploitable.

Moving averages are known to be lagging and this indicator uses a bunch of them, therefore, use it as a confirmation indicator only.
The good news is that it can be greatly optimized by tweaking the lookback periods and choosing the ones you are used to, for example {20, 30, 60, 100, 200, 300, 500, etc.). The above was just an example.
If you are also interested by more technical indicators and using Python to create strategies, then my best-selling book on Technical Indicators may interest you:
Conclusion
Remember to always do your back-tests. You should always believe that other people are wrong. My indicators and style of trading may work for me but maybe not for you.
I am a firm believer of not spoon-feeding. I have learnt by doing and not by copying. You should get the idea, the function, the intuition, the conditions of the strategy, and then elaborate (an even better) one yourself so that you back-test and improve it before deciding to take it live or to eliminate it. My choice of not providing Back-testing results should lead the reader to explore more herself the strategy and work on it more.
To sum up, are the strategies I provide realistic? Yes, but only by optimizing the environment (robust algorithm, low costs, honest broker, proper risk management, and order management). Are the strategies provided only for the sole use of trading? No, it is to stimulate brainstorming and getting more trading ideas as we are all sick of hearing about an oversold RSI as a reason to go short or a resistance being surpassed as a reason to go long. I am trying to introduce a new field called Objective Technical Analysis where we use hard data to judge our techniques rather than rely on outdated classical methods.