


Designing a Powerful Mean Reversion Trading Strategy
A Double Trouble Trading Strategy For Powerful Market Reversals


Mean reversion is a concept in technical analysis that suggests that prices tend to revert to their historical average over time. In other words, when a price deviates significantly from its average value, there’s a tendency for it to eventually move back towards that average.
For example, let’s say a stock’s price typically fluctuates around $50, but due to some event, it suddenly jumps to $70. According to mean reversion theory, there’s a likelihood that the price will eventually move back closer to $50.
This article presents a strategy that combines two powerful technical indicators to generate reversal signals.
A Refresher on K’s Reversal Indicator II
K’s Reversal Indicator II uses a moving average timing technique to deliver its signals. The code is available on TradingView, so do not burden yourself with the calculation. The method of calculation is as follows:
Calculate a moving average (by default, a 13-period moving average).
Calculate the number of times where the market is above its moving average. Whenever that number hits 21, a bearish signal is generated, and whenever that number if zero, a bullish signal is generated.
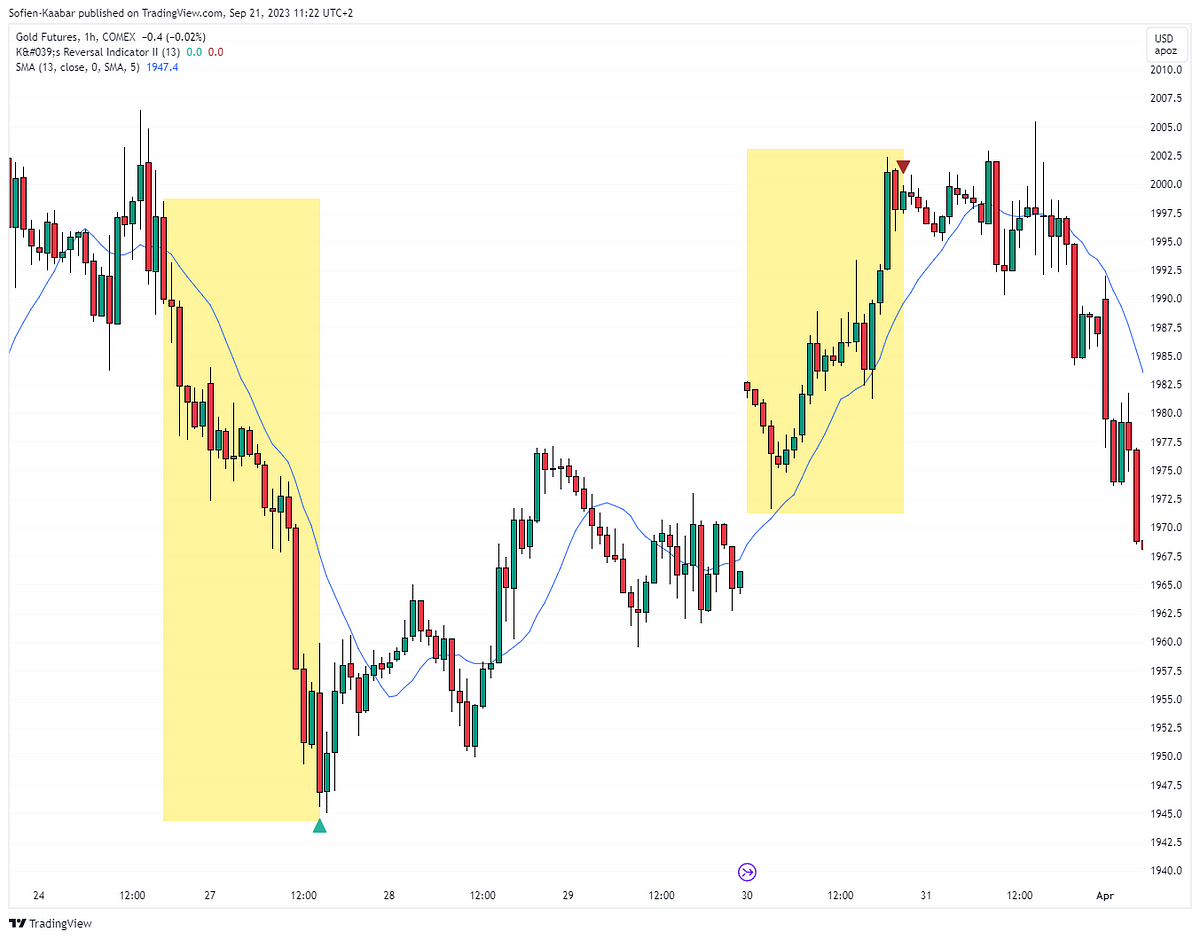
The following chart shows how bullish and bearish signals are formed (the yellow zone contains 21 bars that are above or below the moving average):
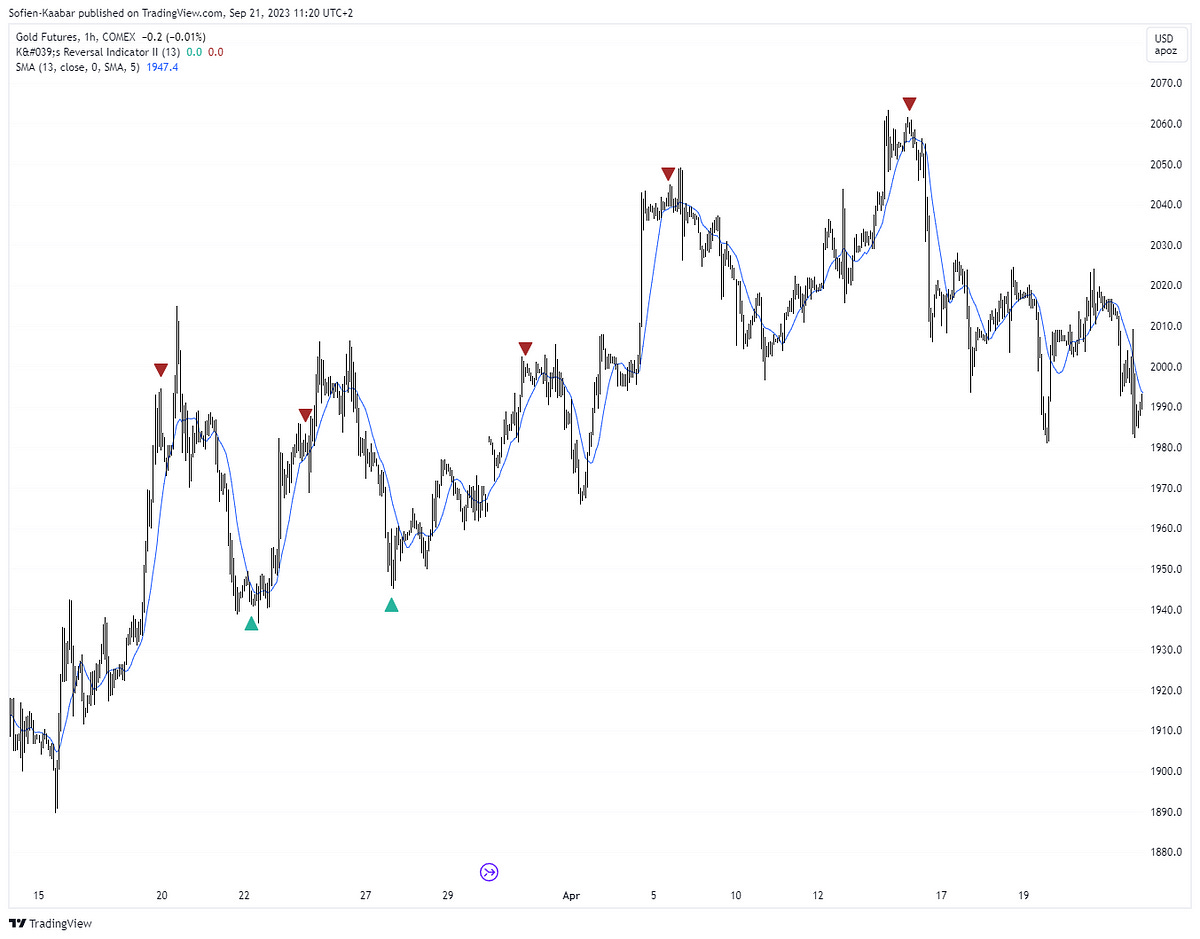
The following chart shows more signals generated from the indicator:
✨ Important note
K’s Reversal Indicator II is available for free on Trading View. You can find it by typing its name in the indicator search bar.
On certain trending markets such as the S&P 500, it seems to handle it better than most contrarian indicators, regarding false signals. The following chart shows how the signals in a trending market seem to be of better quality that what is expected:

It is best used during a ranging market as the probability of success will be greater due to the balance between supply and demand:

If you want to see more of my work, you can visit my website for the books’ catalogue by simply following the link attached the picture.

Bollinger Bands
Bollinger Bands are a tool used in technical analysis to gauge the volatility of a financial asset, like a stock or a currency pair. They consist of three lines plotted on a price chart: a middle line, which is typically a simple moving average (usually of 20 periods), and an upper and lower band that are typically two standard deviations away from the middle line.
These bands expand and contract based on the volatility of the asset. When the market is more volatile, the bands widen, and when it’s less volatile, they contract.
Traders use Bollinger Bands to identify potential buy or sell signals. For example, when the price touches or crosses the upper band, it might indicate that the asset is overbought and due for a downward correction. Conversely, when the price touches or crosses the lower band, it might suggest that the asset is oversold and due for an upward correction.
The strategy presented in this article uses a combination of K’s reversal indicator II and Bollinger bands. It is extremely simple and relies on the powerful signals generated from both indicators.
✨ Important note
Bollinger Bands were developed by John Bollinger in the 1980s. Bollinger was a financial analyst and trader who sought to create a tool that could help traders better understand and analyze market volatility.
He introduced Bollinger Bands as a way to visually represent volatility and identify potential buy and sell signals.
Showing the Strategy
Let’s get to the point of the article. A trading strategy is a set of rules that generate either a bullish or bearish opportunity. The following are the conditions of the strategy:
A bullish signal is generated whenever K’s reversal indicator II detects a bullish opportunity while the market is close or at least around the lower Bollinger band.
A bearish signal is generated whenever K’s reversal indicator II detects a bearish opportunity while the market is close or at least around the upper Bollinger band.
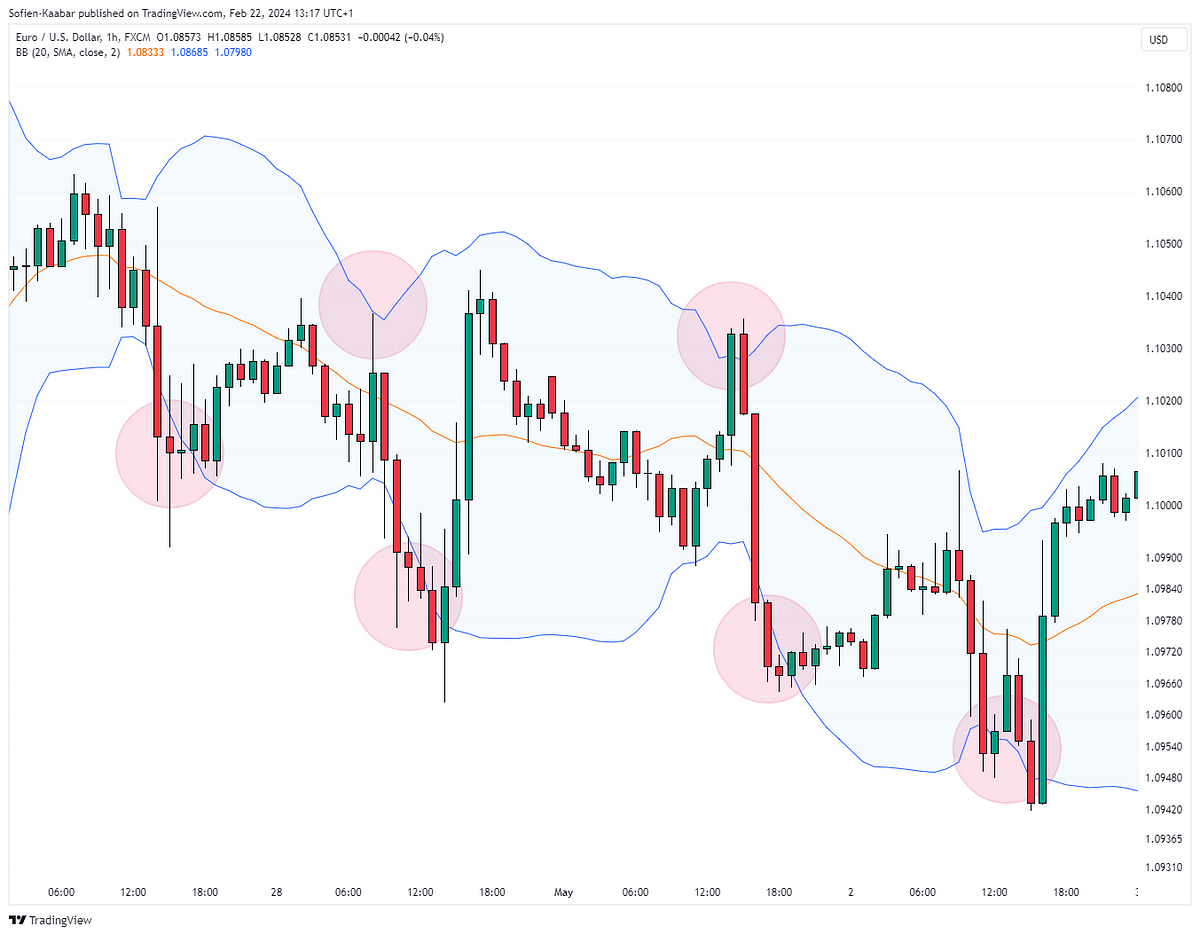
Take a look at the following chart where a bullish signal was generated. Notice how the market, even though at the lower Bollinger band, continued to go down until getting a confirmation from K’s reversal indicator II.

The following chart shows an example of a bearish signal:

Ultimately, it is up to you to decide if the market is close enough to one of the Bollinger bands:

Always be careful from trending markets when dealing with mean-reversion strategies:

You can also check out my other newsletter The Weekly Market Sentiment Report that sends tactical directional views every weekend to highlight the important trading opportunities using a mix between sentiment analysis (COT reports, Put-Call ratio, Gamma exposure index, etc.) and technical analysis.