Creating the MACD Oscillator in TradingView — The Full Guide.
How to Create & Visualize a Simple Technical Oscillator in TradingView.
The MACD is a famous technical oscillator that is composed of the difference between two exponential moving averages which are used in trend-following strategies. This article will present how to create this indicator in Pine Script, the coding language of the charting platform TradingView.
I have just published a new book after the success of my previous one “New Technical Indicators in Python”. It features a more complete description and addition of structured trading strategies with a GitHub page dedicated to the continuously updated code. If you feel that this interests you, feel free to visit the below link, or if you prefer to buy the PDF version, you could contact me on LinkedIn.
The MACD Oscillator
The MACD is probably the second most known oscillator after the RSI. One that is heavily followed by traders. It stands for Moving Average Convergence Divergence and it is used mainly for divergences and flips. Many people also consider it a trend-following indicator but others use graphical analysis on it to find reversal points, making the MACD a versatile indicator.
How is the MACD calculated? It is the difference between the 26-period exponential moving average applied to the closing price and the 12-period exponential moving average also applied to the closing price. The value found after taking the difference is called the MACD line. The 9-period exponential moving average of that calculation is called the MACD signal.
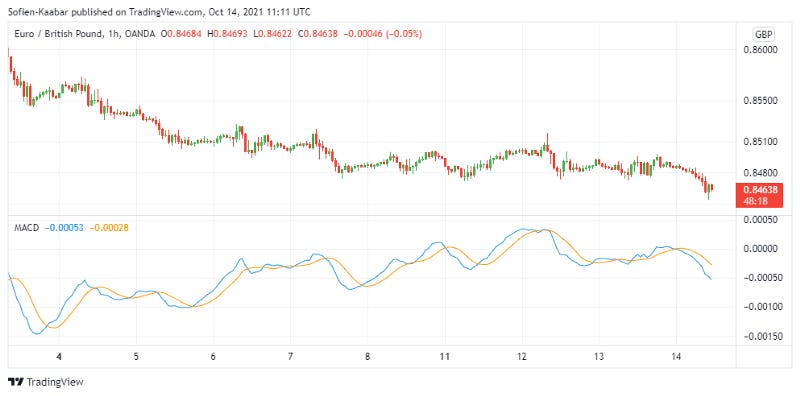
The above chart shows the hourly values of the EURGBP plotted alongside the MACD oscillator where the blue line is the MACD line and the orange line is the MACD signal. Now, our aim is to go to TradingView and code this oscillator ourselves. Why should we do this knowing that it already exists in their proposed indicators?
The answer to this is that this is the first step towards creating our own technical indicators in a reputable charting platform. If we start by understanding the fundamentals of the Pine Script coding language, then by time, we will acquire the necessary skills to become fluent in it and code our own indicators and strategies.
Creating the Oscillator in TradingView
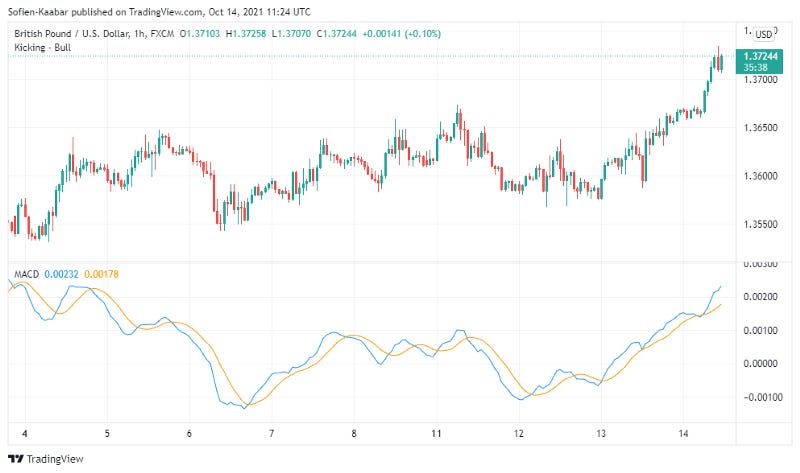
We want to create the MACD oscillator on the GBPUSD values loaded on the TradingView platform. Note that you must create an account to be able to view the charts, the good news is that it is free. Locate the Chart button on the home screen and then choose any asset you would like to calculate the indicator on. Now, on the bottom of the screen, locate Pine Editor and warm up your fingers to do some coding.
The first step is to specify the version of Pine Script. In our case it is 4.
//@version = 4The next step is to specify the name of the indicator (Script) by using the following syntax
study("MACD")Having done the introductory part, we can proceed by defining the parameters of the MACD oscillator. We know that we have three lookback periods we need to define, 12, 26, and 9.
short_term_ema = 12, long_term_ema = 26, signal_ema = 9Now, we are set to calculate the MACD line, which is the difference between the 12-period exponential moving average and the 26-period exponential moving average. the ema() function is a built-in function that calculates this type of moving average given a source which is our closing price and a lookback period which are the ones we have already defined.
fastEMA = ema(close, short_term_ema)
slowEMA = ema(close, long_term_ema)
macd = fastEMA - slowEMANow, all we need is to calculate the MACD signal which is the 9-period simple moving average of the MACD line. The simple moving average also has its own built-in function sma() where it takes the source which in our case is the macd variable and a lookback period which in our case is the one we have defined above.
signal = sma(macd, signal_ema)And finally, we are set to plot the indicator alongside the chart. This is done using the plot() function. It takes a source and a color property as shown below.
plot(macd, color = color.blue)
plot(signal, color = color.orange)
The full code can be found below.
//@version = 4study("MACD")short_term_ema = 12, long_term_ema = 26, signal_ema = 9fastEMA = ema(close, short_term_ema)
slowEMA = ema(close, long_term_ema)macd = fastEMA - slowEMAsignal = sma(macd, signal_ema)plot(macd, color = color.blue)
plot(signal, color = color.orange)What if we want to tweak the oscillator a little bit? Here are some modifications we can make. Make sure to understand the explanations as they will help you in the learning journey.
Modification 1: Change the name of the indicator to “Modified MACD”
Modification 2: Change the lookback periods to 5, 8, and 13.
Modification 3: Change the source of the moving averages to Typical Price.
Modification 4: Change the moving average of the signal line to weighted.
Modification 5: Change the MACD color lines to red and green.
These are fairly easy and intuitive, let us start from the first modification and work our way down until we get the full code. The first modification is easy, we only want to change the name of the indicator to Modified MACD, therefore, we will update the syntax to the below
//@version = 4study("Modified MACD")The next step is to change the lookback periods which is also fairly simple.
short_term_ema = 5, long_term_ema = 8, signal_ema = 13Next, we have to calculate the MACD line based on the typical price and not the actual price. The typical price is simply the average of the last High, Low, and Closing price. This is also referred to as a Pivot Point. The source used for the typical price is hlc3 instead of close.
fastEMA = ema(hlc3, short_term_ema)
slowEMA = ema(hlc3, long_term_ema)
macd = fastEMA - slowEMAThe next step is to calculate the MACD signal using a weighted moving average rather than a simple moving average. This is done through the wma() function.
Also referred to as a weighted moving average, the linear-weighted moving average is a simple moving average that places more weight on recent data. The most recent observation has the biggest weight and each one prior to it has a progressively decreasing weight.
signal = wma(macd, signal_ema)And finally, to change the colors, we only need to modify the properties as shown below.
plot(macd, color = color.red)
plot(signal, color = color.green)Et voilà, the Modified MACD is ready for analysis. This will form a series of indicators and strategies created in Pine Script in the future where the complexity rises in each article. Make sure to read the documentation.
If you are also interested by more technical indicators and using Python to create strategies, then my best-selling book on Technical Indicators may interest you:
Conclusion
Remember to always do your back-tests. You should always believe that other people are wrong. My indicators and style of trading may work for me but maybe not for you.
I am a firm believer of not spoon-feeding. I have learnt by doing and not by copying. You should get the idea, the function, the intuition, the conditions of the strategy, and then elaborate (an even better) one yourself so that you back-test and improve it before deciding to take it live or to eliminate it. My choice of not providing specific Back-testing results should lead the reader to explore more herself the strategy and work on it more.
To sum up, are the strategies I provide realistic? Yes, but only by optimizing the environment (robust algorithm, low costs, honest broker, proper risk management, and order management). Are the strategies provided only for the sole use of trading? No, it is to stimulate brainstorming and getting more trading ideas as we are all sick of hearing about an oversold RSI as a reason to go short or a resistance being surpassed as a reason to go long. I am trying to introduce a new field called Objective Technical Analysis where we use hard data to judge our techniques rather than rely on outdated classical methods.


