Creating and Back-testing a Simple Trend Following Strategy
Creating a Basic Trend Following Strategy and Back-testing it
A trend-following strategy is an investment strategy that involves identifying and capitalizing on trends in financial markets. This strategy involves buying assets that have been trending upward in price or selling assets that have been trending downward in price, with the expectation that the trend will continue.
The basic premise behind trend-following is that markets tend to move in trends, and that these trends can be identified and exploited to generate profits. Trend-following strategies can be applied to a variety of financial assets, including stocks, bonds, commodities, and currencies.
The Fibonacci Trading Book is finally out! Filled with Fibonacci-based trading methods (tools, indicators, patterns, and strategies), this book will guide you through improving your trading and analysis by incorporating an important technical analysis approach that is Fibonacci. (Link to pay in PayPal for the PDF version at the end of the article)
Creating the Rules of the Strategy
This article aims to create basic rules to follow the trend and see how to back-test them. Simplicity is emphasized and therefore, the aim is more or less, the framework. The trading strategy has the following rules:
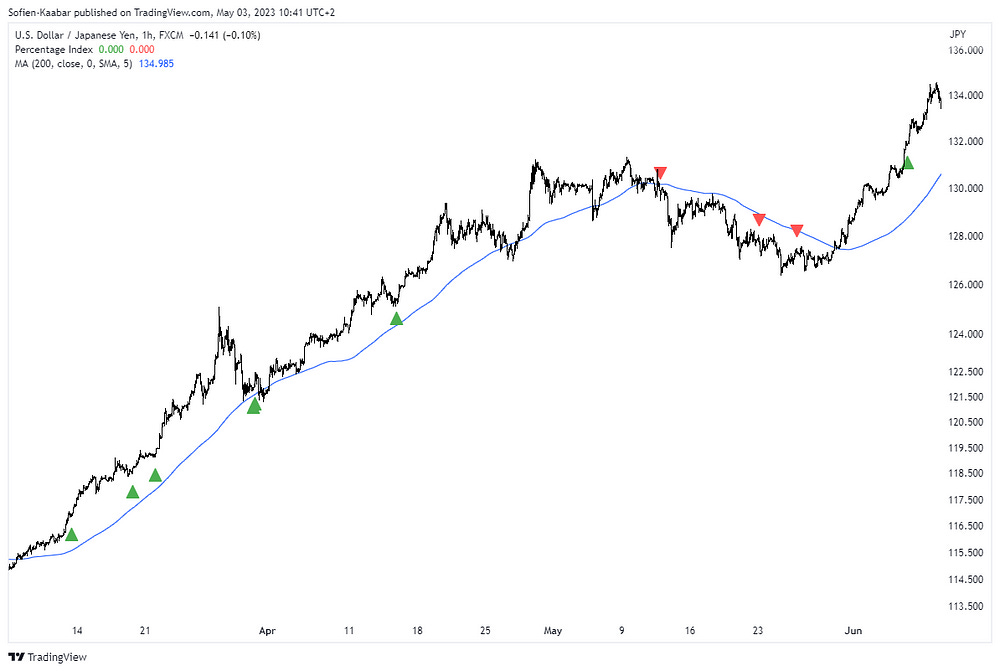
For a buy signal, the market must be above its 200-period moving average and has shaped a low price equal to the previous low price.
For a sell signal, the market must be below its 200-period moving average and has shaped a high price equal to the previous high price.
The code to generate the signal charts is as follows:
// This source code is subject to the terms of the Mozilla Public License 2.0 at https://mozilla.org/MPL/2.0/
// © Sofien-Kaabar

//@version=5
indicator("Simple Trend Following Signals", overlay = true)

buy_signal = low == low[1] and close > ta.sma(close, 200)
sell_signal = high == high[1]  and close < ta.sma(close, 200)

plotshape(buy_signal,  style = shape.triangleup,   color = color.green,  location =  location.belowbar, size = size.small)
plotshape(sell_signal, style = shape.triangledown, color = color.red, location = location.abovebar, size = size.small)Zooming out, the strategy looks like this:
Its preferred ground is a stable trending market ratehr than a choppy volatile one, as is the case for all trend following strategies.
A Simplistic Back-test
Back-testing is a deep field that requires a lot of data, sound hypotheses, proper risk management, and real life simulation. In TradingView, you are generally limited by data and therefore the back-tests before are not meaningful. The main aim from this section is to show the code for a simple back-test of the strategy where the signals are opened and closed when a new signal is found. The following show the equity curves on EURUSD, NZDUSD, and USDJPY:
If you want to see how to create all sorts of algorithms yourself, feel free to check out Lumiwealth. From algorithmic trading to blockchain and machine learning, they have hands-on detailed courses that I highly recommend.
Learn Algorithmic Trading with Python Lumiwealth
Learn how to create your own trading algorithms for stocks, options, crypto and more from the experts at Lumiwealth. Click to learn more
The following show the equity curves on GBPAUD and AUDNZD:
Trading strategies can go either way and are impacted by a huge number of variables, namely: the market regime, the number of data, the time period, the time frame, transaction costs, the predictive ability of the strategy, the risk management system, volatility, entry and exit management, drawdown, capital, etc.
The code you can use for a basic framework of the strategy is as follows:
//@version=5
strategy("My strategy", overlay=true, margin_long=100, margin_short=100)

longCondition = low == low[1] and close > ta.sma(close, 200)
if (longCondition)
    strategy.entry("My Long Entry Id", strategy.long)

shortCondition = high == high[1]  and close < ta.sma(close, 200)
if (shortCondition)
    strategy.entry("My Short Entry Id", strategy.short)
Clearly the back-tests lack data. This is why, in a future article, the back-test of this strategy will be done using Python where more data is accessible.


