


Regime identification is crucial for market analysis, but it’s never simple. Complex calculations are sometimes needed, but simple methods can also be employed such as moving averages.
This article discusses an alternative way.
The Relative Strength Index (RSI)
The RSI is one of the most misunderstood tools in technical analysis. People either obsess over it like it’s a magic wand or dismiss it completely because of how often it fails in isolation. Both camps are wrong. RSI isn’t magic. It’s not worthless either. It’s a signal—and like any signal, it needs context.
Let’s break it down.
RSI is a momentum oscillator that measures the speed and change of price movements. It was developed by J. Welles Wilder Jr. and introduced in his 1978 book New Concepts in Technical Trading Systems.
It moves between 0 and 100. Traditionally:
Over 70 = Overbought
Under 30 = Oversold
But that’s just the headline. The real use comes from understanding why RSI behaves the way it does. Let’s get under the hood.
RSI = 100 – (100 / (1 + RS))
Where RS (Relative Strength) = Average Gain over N periods / Average Loss over N periods
Most traders use 14 periods by default.
Here’s the sequence:
Look back at the last 14 periods.
Calculate smoothed average gains (only from up periods).
Calculate smoothed average losses (only from down periods).
Divide the two. That’s your RS.
Plug RS into the RSI formula.
The result is a number between 0 and 100 that reflects recent price momentum.

RSI Regime Persistence
This is not a momentum indicator and not a signal generator. It is a state classifier.
Its purpose is to answer one question only:
Has RSI stayed in a structurally bullish or bearish regime long enough to be considered a trend, or is the market still ranging?
This is crucial because:
Most indicators fail not because they are bad
But because they are applied in the wrong regime
Stop Guessing. Start Trading with The Signal Beyond report 🚀
COT Data • Technical charts • Equity Arbitrage • Seasonality
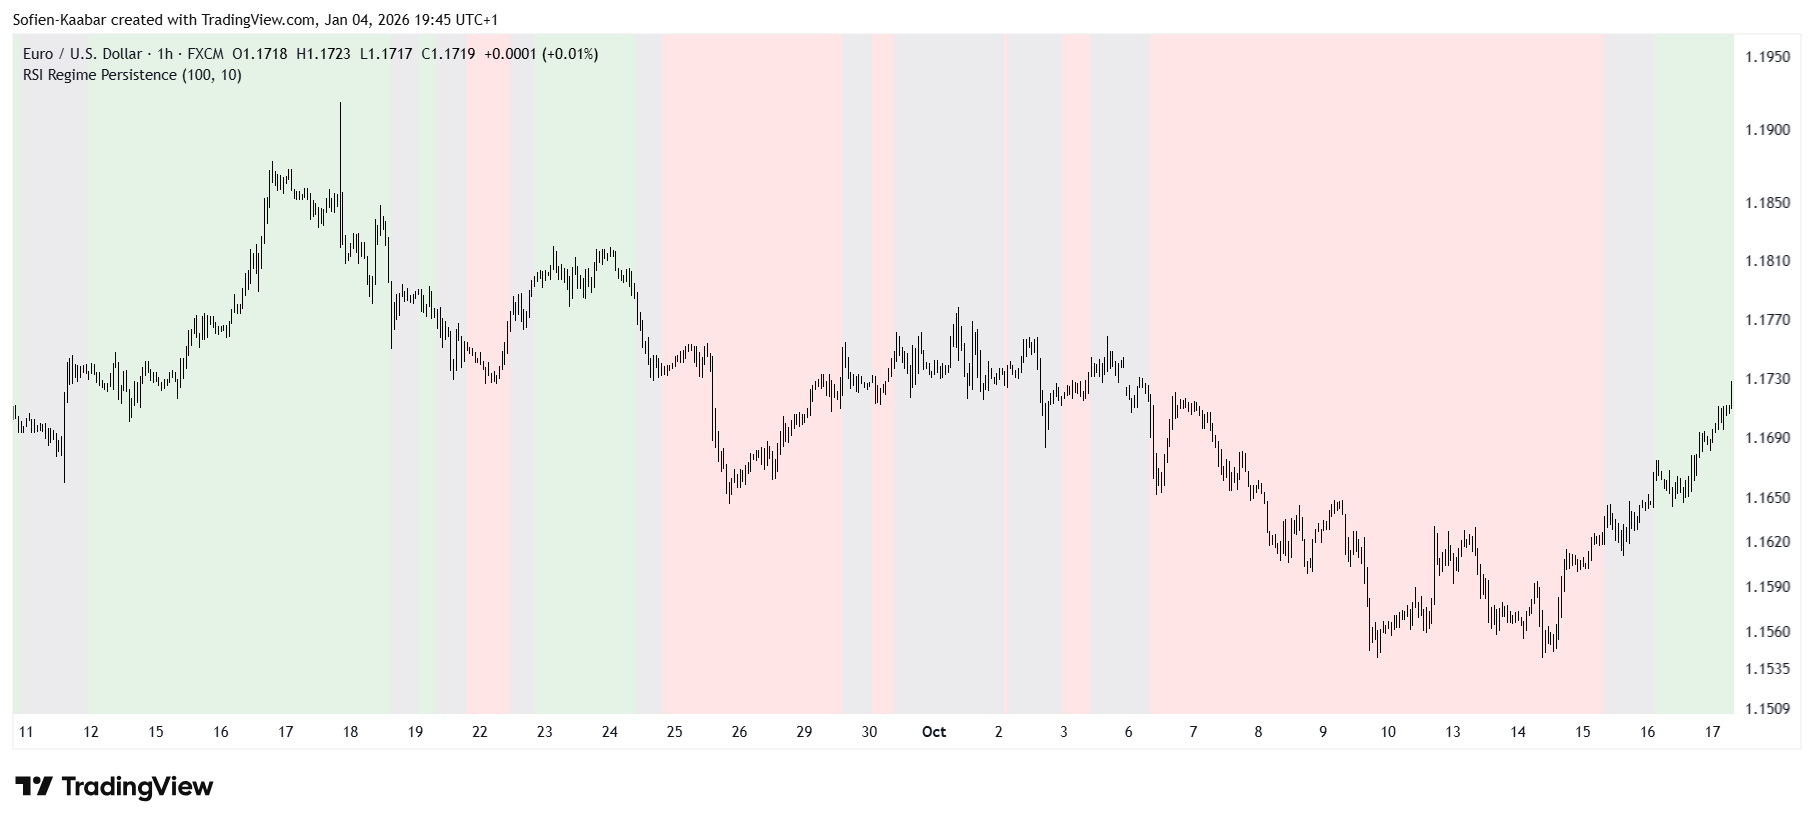
This script turns a long-lookback RSI into a regime classifier rather than a trading signal: it computes a slow RSI and checks whether it stays consistently above or below the 50 level, within bounded ranges, for several consecutive bars to define bullish or bearish behavior.
It then counts how long these conditions persist using duration counters, and only labels the market as a true bullish or bearish trend if the corresponding regime has lasted longer than a user-defined threshold, otherwise classifying the market as range or transition.
The result is displayed as background colors on the price chart green for persistent bullish regimes, red for persistent bearish regimes, and gray when no regime has proven itself yet, making the indicator a high-level trend state filter rather than an entry or exit tool.
// This source code is subject to the terms of the Mozilla Public License 2.0 at https://mozilla.org/MPL/2.0/
// © Sofien-Kaabar

//@version=5
indicator("RSI Regime Persistence", overlay = true)

lookback = input.int(100, title = "RSI Lookback")
range_threshold = input.int(10, title = "Range Sensitivity (lower = more sensitive)")

rsi = ta.rsi(close, lookback)

bullish_regime =
     rsi > 50 and rsi < 75 and
     rsi[1] > 46 and rsi[2] > 46 and rsi[3] > 46

bearish_regime =
     rsi < 50 and rsi > 25 and
     rsi[1] < 54 and rsi[2] < 54 and rsi[3] < 54

var int bull_duration = 0
var int bear_duration = 0

if bullish_regime and not bearish_regime
    bull_duration += 1
    bear_duration := 0
else if bearish_regime and not bullish_regime
    bear_duration += 1
    bull_duration := 0
else
    bull_duration := 0
    bear_duration := 0

is_bull_trend = bullish_regime and bull_duration >= range_threshold
is_bear_trend = bearish_regime and bear_duration >= range_threshold

bgcolor(is_bull_trend ? color.new(color.green, 85) :is_bear_trend ? color.new(color.red, 85) :na)

is_range =
     bull_duration < range_threshold and
     bear_duration < range_threshold

bgcolor(is_range ? color.new(color.gray, 85) : na)
range_threshold is the minimum persistence requirement for a regime to be considered a trend. It is not about RSI strength, but about how long the structure survives.
How tuning changes behavior
Low values (10–25)
Quickly labels trends, more regime churn, higher reclassification risk.Medium values (30–60)
Good balance between responsiveness and stability.High values (80–150)
Only very persistent trends are recognized; most markets will appear as range.
Master Deep Learning techniques tailored for time series and market analysis🔥
My book breaks it all down from basic machine learning to complex multi-period LSTM forecasting while going through concepts such as fractional differentiation and forecasting thresholds. Get your copy here 📖!
Thank you!
I use a similar method in one of my algos, and it’s working pretty well.
I’ve just started a new series of newsletters in which I’ll try to find the best way to define the trend (the first one is coming tomorrow). I’ll probably add your method at the end! 😉