Creating a Powerful Technical Strategy With the RSI and RVI
Fusing the RSI and the RVI for a Powerful Trading Strategy
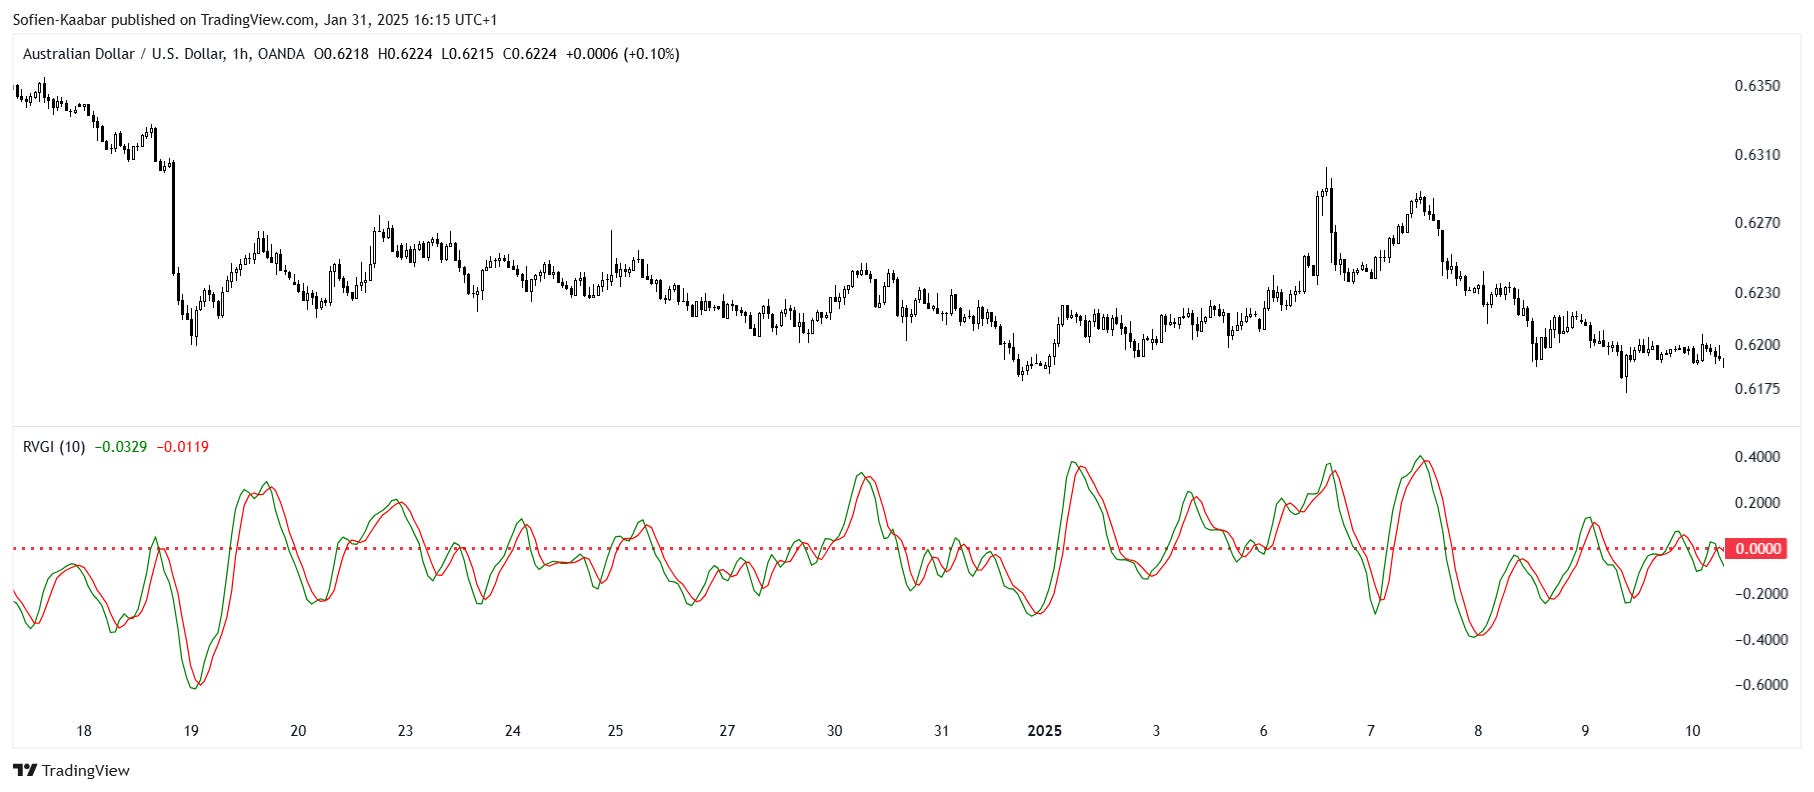
Another famous and relatively complex indicator will be discussed in this article. It is a contrarian oscillator that is best used in ranging markets. I am of course talking about the relative vigor index (RVI). In this article, we will present the fundamentals and how to code it.
The Building Blocks
The RVI is composed of many building blocks, namely the totality of OHLC data and moving averages. It seeks to measure the strength of the trend by comparing the ranges between the open/close and high/low values. It is an unbounded indicator that oscillates around the zero line with many strategies possible to be formed using it, namely divergences and crosses.
The numerator line of the Relative Vigor can be calculated this way:
Calculate the current difference between the closing and opening price. Let’s call this variable A.
Calculate the difference between the current closing price and the opening price from one period ago. Let’s call this variable B. Multiply the result by 2.
Calculate the difference between the current closing price and the opening price two periods ago. Let’s call this variable C. Multiply the result by 2.
Calculate the difference between the current closing price and the opening price three periods ago. Let’s call this variable D.
The denominator line of the Relative Vigor can be calculated this way:
Calculate the current difference between the high and low price. Let’s call this variable E.
Calculate the difference between the current high price and the low price one period ago. Let’s call this variable F. Multiply the result by 2.
Calculate the difference between the current high price and the low price two periods ago. Let’s call this variable G. Multiply the result by 2.
Calculate the difference between the current high price and the low price three periods ago. Let’s call this variable H.
The formula for the Relative Vigor Index is as follows:
We can see that it is some form of a smoothed ratio between the range of the close/open and high/low. As it is unbounded, it is often accompanied by a signal line derived from its calculation as follows:
Trading the Relative Vigor Index
One of the usual techniques to apply on trading indicators is the signal line. This line is usually a very short-term moving average applied on the indicator, but it is calculated differently for this indicator as seen in the previous part.
A buy (Long) signal is generated whenever the RVI crosses its signal line from the below to the above.
A sell (Short) signal is generated whenever the RVI crosses its signal line from the above to the below.
To avoid false signals from randomness of the crosses that occur when the indicator is not on its extremes, we can add an RSI condition where we only initiate positions if the cross happens while a certain condition is met on the RSI. For example, we can create the following trading rules:
A buy (Long) signal is generated whenever the 10-period RVI crosses its signal line from the below to the above while the 14-period RSI is below 30.
A sell (Short) signal is generated whenever the 10-period RVI crosses its signal line from the above to the below while the 14-period RSI is above 70.
Check out my newsletter that sends weekly directional views every weekend to highlight the important trading opportunities using a mix between sentiment analysis (COT report, put-call ratio, etc.) and rules-based technical analysis.


