Counting Up & Down Periods to Generate Trading Signals
Coding & Back-testing the Time’s Up Trading Indicator in Python
What if we think of an extremely simple concept? Counting the number of positive and negative days and deriving trading signals from them is something we can try to demystify and see whether it is profitable or not.
The main idea of the Time’s Up Indicator is to count the consecutive up and down days and see whether a pattern is formed on specific barriers. For example does having five consecutive up days consistently provide a reaction to the downside? It is not very likely in such a complex market but it is worth seeing and back-testing.
For a detailed and thorough collection of contrarian trading strategies, you can check out my book. The book features a huge number of classic and modern techniques as it dwelves into the realm of technical analysis with different trading strategies. The book comes with its own GitHub.
Contrarian Trading Strategies in Python
Amazon.com: Contrarian Trading Strategies in Python: 9798434008075: Kaabar, Sofien: Booksamzn.to
Creating the Time’s Up Indicator
As mentioned in the introduction, the Time’s Up Indicator will be a counter of the consecutive positive and negative days. For example, if we have three days where the closing price is greater than the opening price, then the Time’s Up Indicator will show a reading of 3.
The idea is to search for reversal patterns and back-test them. Later, we can simply try to optimize the barriers by looping around them. We can sum up the steps required to calculate this indicator:
Calculate the price difference between the current market price and the one preceding it. This gives us the change in price.
Create a column where we input the following condition: if the change is positive, then the current value in the column equals the previous one plus one.
Create a column where we input the following condition: if the change is negative, then the current value in the column equals the previous one plus one. We can multiply the result by -1 to obtain negative values.
Sum the values from the second column and the third column to arrive at the Time’s Up Indicator.
To code the Indicator, we need to have an OHLC array (not a data frame) and define the following three small manipulation functions:
# The function to add a certain number of columns
def adder(Data, times):

    for i in range(1, times + 1):

        z = np.zeros((len(Data), 1), dtype = float)
        Data = np.append(Data, z, axis = 1)

    return Data
# The function to deleter a certain number of columns
def deleter(Data, index, times):
for i in range(1, times + 1):
Data = np.delete(Data, index, axis = 1)
return Data# The function to delete a certain number of rows from the beginning
def jump(Data, jump):
Data = Data[jump:, ]
return Datadef time_up(Data, width, what, where):
# Adding the required columns
Data = adder(Data, 4)
# Calculating the difference in prices
for i in range(len(Data)):
Data[i, where] = Data[i, what] - Data[i - width, what]
# Upward Timing
for i in range(len(Data)):
Data[0, where + 1] = 1
if Data[i, where] > 0:
Data[i, where + 1] = Data[i - width, where + 1] + 1
else:
Data[i, where + 1] = 0
# Downward Timing
for i in range(len(Data)):
Data[0, where + 2] = 1
if Data[i, where] < 0:
Data[i, where + 2] = Data[i - width, where + 2] + 1
else:
Data[i, where + 2] = 0
# Changing signs
Data[:, where + 2] = -1 * Data[:, where + 2]
# Time's Up Indicator
Data[:, where + 3] = Data[:, where + 1] + Data[:, where + 2]
# Cleaning rows/columns
Data = deleter(Data, where, 3)
return DataOf course, to easily calculate the indicator, we need an OHLC array. The width is there to change the lookback period. For example, if it were set to 1, the calculation would be for the current closing price and the one preceding it, while if it were set to 4, it would be the one 4 periods ago.
Back-testing the Strategy
What would be the strategy with a simple counter such as the one we have developed above? We can probably add a volatility adjustment? a smoothing factor that gives us more comprehensible signals? Something like the below:
Multiplying by the values of the Average True Range to get a volatility-adjusted Time’s Up Indicator.
Calculating a 3-period moving average on the Time’s Up Indicator.
Fortunately, we will not be doing all of the above. We will start by the first step of any research and back-test; performing a raw analysis. Therefore, we will back-test the indicator as it is.
Two things we have to take into account are the barriers (where do we fade the move) and the risk management technique. The latter will be discussed in a later part but for now, we can just say that it depends on a 0.20 risk-reward ratio forced by the Average True Range Indicator. The former can be 4 at the moment, but in a later part we will try to optimize it. Therefore, the trading consditions become:
Go long (Buy) whenever the Time’s Up Indicator is showing a value of -4.
Go short (Sell) whenever the Time’s Up Indicator is showing a value of 4.
def signal(Data, time_up, buy, sell):

    for i in range(len(Data)):

        if Data[i, time_up] >= upper_barrier and Data[i - 1, time_up] < upper_barrier:
            Data[i, sell] = -1

        if Data[i, time_up] <= lower_barrier and Data[i - 1, time_up] < lower_barrier:
            Data[i, buy] = 1
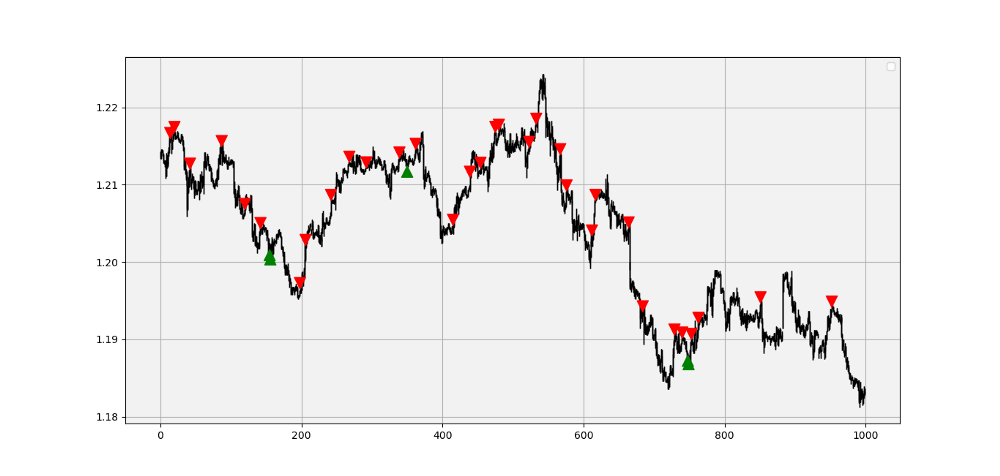
An example of the trading signals generated using the above function can be found in the following plot:
Now, for the results that are not impressive. The transaction costs used are 0.5 pips spread per round trade on hourly data since January 2010.
Optimization & Search for Optimal Timing
What if 4 is not the best barrier to choose? What if each currency pair has its own barrier? These are the questions that should be asked when trying to optimize the strategy. An additional question can be, what kind of risk management system is best fitted for this type of strategies. Let us try to loop from 3 barriers to 8 barriers and see which one on average performs better than the others.
For simplicity, let us do this loop on one currency pair, the EURUSD due to its liquidity and low transaction costs compared to the others.
It seems like when we put the barriers at 5, the EURUSD underperforms less than when we put other barriers.
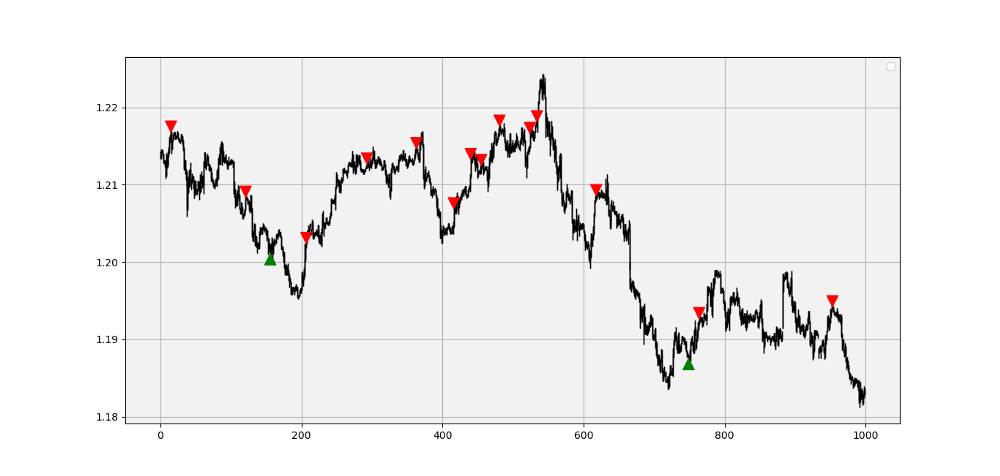
With the signal chart giving the us the following trading triggers:
Obviously, the Time’s Up Indicator is nothing but a counter than can be used in many other strategies. The above back-test was just a hypothetial example of how we can approach other indicators but in no way is the counter good for profitable trading.
Even when we try optimizing the width variable described above, we get the following equity curves which tell us it is better to keep the width = 1.
If you want to see how to create all sorts of algorithms yourself, feel free to check out Lumiwealth. From algorithmic trading to blockchain and machine learning, they have hands-on detailed courses that I highly recommend.
Learn Algorithmic Trading with Python Lumiwealth
Learn how to create your own trading algorithms for stocks, options, crypto and more from the experts at Lumiwealth. Click to learn more
Summary
To sum up, what I am trying to do is to simply contribute to the world of objective technical analysis which is promoting more transparent techniques and strategies that need to be back-tested before being implemented. This way, technical analysis will get rid of the bad reputation of being subjective and scientifically unfounded.
I recommend you always follow the the below steps whenever you come across a trading technique or strategy:
Have a critical mindset and get rid of any emotions.
Back-test it using real life simulation and conditions.
If you find potential, try optimizing it and running a forward test.
Always include transaction costs and any slippage simulation in your tests.
Always include risk management and position sizing in your tests.
Finally, even after making sure of the above, stay careful and monitor the strategy because market dynamics may shift and make the strategy unprofitable.


