Coding the Smoothed Stochastic Oscillator in Trading View
How to Code and Use the Smoothed Stochastic Oscillator in Trading View
The stochastic oscillator can have many variations, notably the smoothed stochastic oscillator (SSO). This article shows how to create this indicator in Trading View.
The Fibonacci Trading Book is finally out! Filled with Fibonacci-based trading methods (tools, indicators, patterns, and strategies), this book will guide you through improving your trading and analysis by incorporating an important technical analysis approach that is Fibonacci [PDF Version available, see end of article).
The Fibonacci Trading Book
Amazon.com: The Fibonacci Trading Book: 9798394344046: Kaabar, Sofien: Booksamzn.to
The Stochastic Oscillator
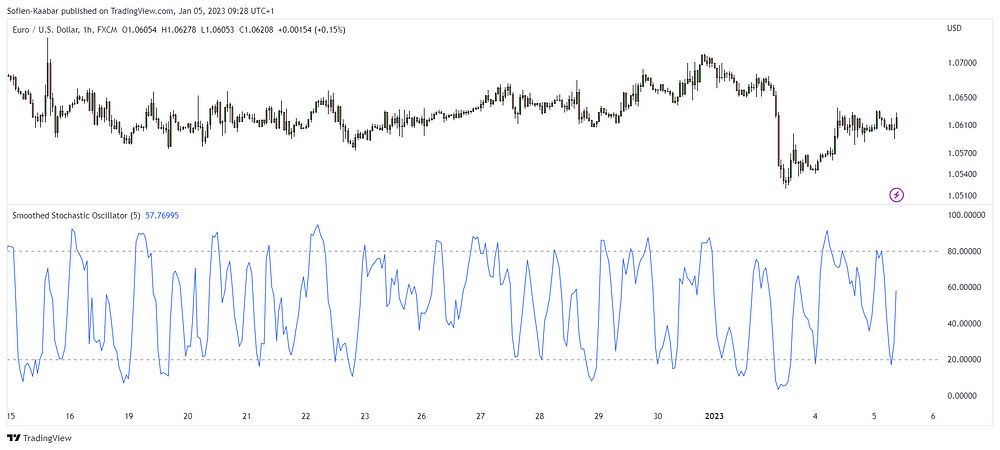
One of the known technical indicators is the stochastic oscillator which is a form of data normalization aimed to trap the market values between 0 and 100 so that we get an idea on extreme values. The following chart shows the stochastic oscillator.
Coding the Smoothed Stochastic Oscillator
The SSO is calculated on the smoothed HLC data instead of the raw data. By taking a moving average of the highs, lows, and close prices and applying the stochastic formula on them, we get the SSO.
The code of the indicator in Pine Script is as follows:
// This source code is subject to the terms of the Mozilla Public License 2.0 at https://mozilla.org/MPL/2.0/
// © Sofien-Kaabar
//@version=5

indicator("Smoothed Stochastic Oscillator")
lookback = input(defval = 5, title = 'Lookback')

open_smoothed = ta.wma(open, lookback)
high_smoothed = ta.wma(high, lookback)
low_smoothed  = ta.wma(low, lookback)
close_smoothed = ta.wma(close, lookback)

slow_stochastic_nom   = close_smoothed - ta.lowest(low_smoothed, lookback)
slow_stochastic_denom = ta.highest(high_smoothed, lookback) - ta.lowest(low_smoothed, lookback)
slow_stochastic = slow_stochastic_nom / slow_stochastic_denom * 100

plot(slow_stochastic)
hline(20)
hline(80)The oversold area is at 20 and the overbought area is at 80. Re-integrating normaly from either areas yields a contrarian view. This means that a market that has been below 20 and suddenly surpasses it, gives a bullish signal.
Pay Kaabar using PayPal.Me
Go to paypal.me/sofienkaabar and type in the amount. Since it’s PayPal, it’s easy and secure. Don’t have a PayPal…paypal.me
If you want to see how to create all sorts of algorithms yourself, feel free to check out Lumiwealth. From algorithmic trading to blockchain and machine learning, they have hands-on detailed courses that I highly recommend.
Learn Algorithmic Trading with Python Lumiwealth
Learn how to create your own trading algorithms for stocks, options, crypto and more from the experts at Lumiwealth. Click to learn more


