Coding the Augmented Bollinger Bands in TradingView
How to Code & Use the Augmented Bollinger Bands in Pine Script
The great Bollinger Bands are one of the first things we must learn when analyzing time series. This is because of their sound statistical reasoning, their wide adoption across market participants, and their success when deployed in trading strategies. We can also see other variations that resemble the Bands in an attempt to enhance it. This article will show how to code the Augmented Bollinger Bands using Pine Script (TradingView’s coding language).
I have released a new book after the success of my previous one “Trend Following Strategies in Python”. It features advanced contrarian indicators and strategies with a GitHub page dedicated to the continuously updated code. If you feel that this interests you, feel free to visit the below Amazon link (which contains a sample), or if you prefer to buy the PDF version, you could check the link at the end of the article.
Contrarian Trading Strategies in Python
Amazon.com: Contrarian Trading Strategies in Python: 9798434008075: Kaabar, Sofien: Bookswww.amazon.com
The Augmented Bollinger Bands
We are familiar with the Bollinger Bands where we use them to initiate contrarian positions whenever the market reaches the upper band or the lower band as we expect that statistically, the market is overbought or oversold, hence by using standard deviation we are able to have a view on the likely reaction of the market off current levels.
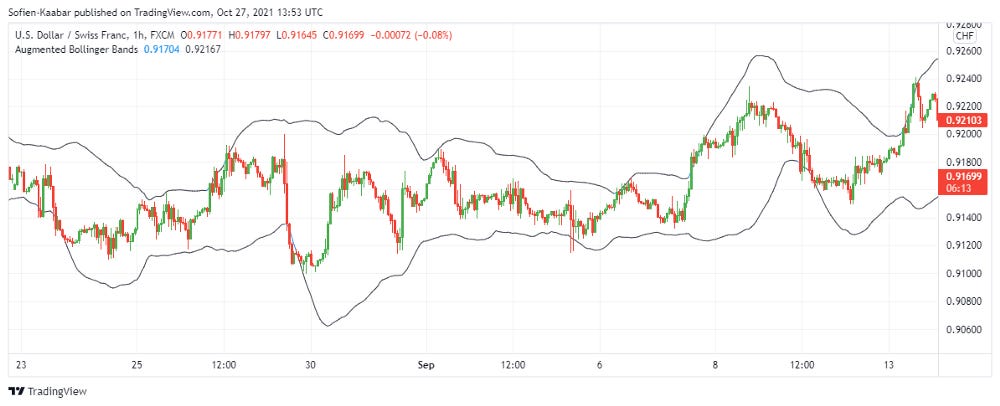
The Augmented Bollinger Bands are simply a modified version of the original Bollinger Bands where the bands are calculated on the extremes rather just the closing prices. This has the advantage of taking into account volatility and potentially enhancing the dynamic support and resistance levels. Below are the steps required to calculate the Augmented Bollinger Bands:
Calculate a 20-period weighted moving average of the highs.
Calculate a 20-period weighted moving average of the lows.
Calculate the standard deviation of both highs and lows.
To find the upper band, we multiply the standard deviation of the highs moving average and add it to the current moving average.
To find the lower band, we multiply the standard deviation of the lows moving average and subtract it from the current moving average.
Coding the Augmented Bollinger Bands Step-By-Step
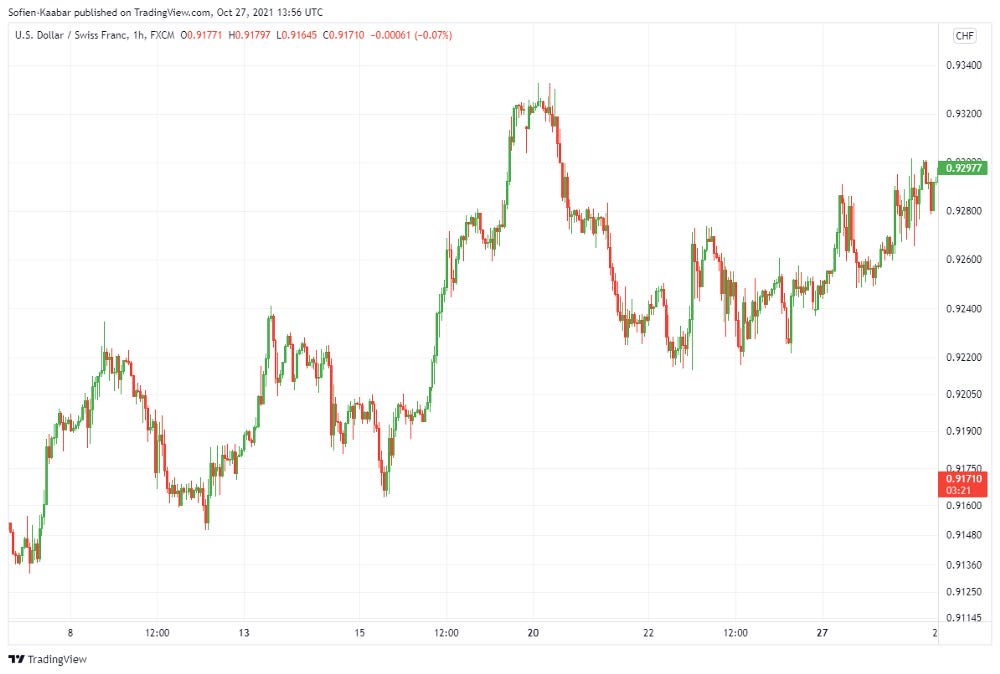
We want to create the Augmented Bollinger Bands on the USDCHF values loaded on the TradingView platform. Note that you must create an account to be able to view the charts, the good news is that it is free. Locate the Chart button on the home screen and then choose any asset you would like to calculate the indicator on. Now, on the bottom of the screen, locate Pine Editor and warm up your fingers to do some coding.
The first step is to specify the version of Pine Script. In our case it is 5. We must set the overlay argument to true because we want to chart the bands in the same panel as the price. Setting it to false will put the bands in another panel which makes it difficult to analyze.
//@version=5
indicator("Augmented Bollinger Bands", overlay = true)
Now, we will define the parameters for the bands which are by default a 40-period linear-weighted moving average and a 2x standard deviation.
lookback = 40
std = 2
Then, we will calculate two moving averages, one applied to the highs and the other applied to the lows. This is done using the ta.wma() function which returns the linear-weighted moving average.
ma_high = ta.wma(high, lookback)
ma_low  = ta.wma(low, lookback)
Now, we will calculate the standard deviation on both moving averages.
standard_deviation_h = ta.stdev(high, lookback)
standard_deviation_l = ta.stdev(low, lookback)
The last step is to calculate Augmented Bollinger Bands by applying the classical formula.
upper_augmented_boll = ma_high + (std * standard_deviation_h)
lower_augmented_boll = ma_low - (std * standard_deviation_l)
Let us plot the bands and add a condition that states if the market is below
plot(lower_augmented_boll, color = lower_augmented_boll > close? color.blue : color.black)
plot(upper_augmented_boll, color = upper_augmented_boll < close? color.blue : color.black)This will form a series of indicators and strategies created in Pine Script in the future where the complexity rises in each article. Make sure to read the documentation. Meanwhile, here is the full code. You can check out my profile in TradingView for other indicators.
// This source code is subject to the terms of the Mozilla Public License 2.0 at https://mozilla.org/MPL/2.0/
// © Sofien-Kaabar
//@version=5
indicator("Augmented Bollinger Bands", overlay = true)lookback = 40
std = 2ma_high = ta.wma(high, lookback)
ma_low = ta.wma(low, lookback)standard_deviation_h = ta.stdev(high, lookback)
standard_deviation_l = ta.stdev(low, lookback)upper_augmented_boll = ma_high + (std * standard_deviation_h)
lower_augmented_boll = ma_low - (std * standard_deviation_l)plot(lower_augmented_boll, color = lower_augmented_boll > close? color.blue : color.black)
plot(upper_augmented_boll, color = upper_augmented_boll < close? color.blue : color.black)If you want to see how to create all sorts of algorithms yourself, feel free to check out Lumiwealth. From algorithmic trading to blockchain and machine learning, they have hands-on detailed courses that I highly recommend.
Learn Algorithmic Trading with Python Lumiwealth
Learn how to create your own trading algorithms for stocks, options, crypto and more from the experts at Lumiwealth. Click to learn more
Summary
To sum up, what I am trying to do is to simply contribute to the world of objective technical analysis which is promoting more transparent techniques and strategies that need to be back-tested before being implemented. This way, technical analysis will get rid of the bad reputation of being subjective and scientifically unfounded.
I recommend you always follow the the below steps whenever you come across a trading technique or strategy:
Have a critical mindset and get rid of any emotions.
Back-test it using real life simulation and conditions.
If you find potential, try optimizing it and running a forward test.
Always include transaction costs and any slippage simulation in your tests.
Always include risk management and position sizing in your tests.
Finally, even after making sure of the above, stay careful and monitor the strategy because market dynamics may shift and make the strategy unprofitable.


