
Coding & Trading Psychological Levels in Python.
Let's Create a Strategy Based on Forecasting Market Reactions Close to Psychological Levels.

Detecting support & resistance levels is a highly subjective field of analysis and this explains the complete discrepancy between results. However, it should not be this way because we have many ways of making the subjective part rather objective. We can do this in many ways, among them are psychological levels, an interesting phenomenon based on human psychology and anchoring. In this article, we will present the concept of psychological levels, code them in Python, and then evaluate a simple strategy based on them.
I have just published a new book after the success of my previous one “New Technical Indicators in Python”. It features a more complete description and addition of structured trading strategies with a Github page dedicated to the continuously updated code. If you feel that this interests you, feel free to visit the below link, or if you prefer to buy the PDF version, you could contact me on Linkedin.
The Book of Trading Strategies
Amazon.com: The Book of Trading Strategies: 9798532885707: Kaabar, Sofien: Bookswww.amazon.com
Introduction to Support & Resistance Levels
At its purest form, a support level is an area supposed to keep prices from going down further. Naturally, when the market price approaches a support area, the right decision is to have a bullish bias.

A resistance level is an area supposed to keep prices from going up further. Naturally, when the market price approaches a resistance area, the right decision is to have a bearish bias.
By subscribing, you are supporting me and unlocking all of the articles that deal with trading, back-testing, and strategy research. As for consistency, you can expect between 4-7 articles per week.
Introduction to Psychological Levels
Psychological levels form an important part in any analysis. The reason for this is because mentally, they are given more attention than other levels. For instance, which price would you retain more in your mind if you come across it? 1.1500 on the EURUSD or 1.3279 on the GBPUSD? By Psychological Levels, we are talking about either round numbers (such as 1.2000 on the EURUSD) or simply par numbers (such as 1.000 USDCHF or $100 on Apple stock).
Clearly, round numbers are the first part of a psychological price. The other part is simply significance. For example, the par-value or par-level such as 1.000 on the USDCHF or 100.00 on the USDJPY is considered a par-level. The basic idea is that around these levels, market participants may choose to place their orders, hence, a form of reaction may happen.

Our aim is to develop an algorithm that trades whenever the market reaches a psychological level. This is done using a very simple loop function in Python discussed later.
Creating a Strategy Based on Psychological Levels
Our main goal is to create an algorithm that loops around the historical data and identifies the psychological closing prices which can be {1.2900, 0.7500, 1.0000, 1.5100}. For this we need to tell the algorithm to:
Perform a general loop across all data in the fourth column which harbors the closing prices.
Mark the times when there is a closing price ending in a hundred pips position such as 1.1000 or 2.300.
Increase the interval by 100 pips (0.0100) each time so that we scan for all possible levels.
The Python syntax to do this can be written down as follows.
def psychological_levels_scanner(Data, close, where):

    # Adding buy and sell columns
    Data = adder(Data, 10)

    # Rounding for ease of use
    Data = rounding(Data, 4)

    # Threshold
    level     = 1.00

    # Scanning for Psychological Levels
    for i in range(len(Data)):

        for i in range(len(Data)):

            if Data[i, close] == level:

                Data[i, where] = 1

        level = round(level + 0.01, 2)
        if level > 5:
            break

    return Data

# You can choose your starting level. To be sure you will get all the psychological levels, you can start at zero
As with any proper research method, the aim is to test the strategy and to be able to see for ourselves whether it is worth having as an add-on to our pre-existing trading framework or not.
The first step is creating the trading rules. When will the system buy and when will it go short? In other words, when is the signal given that tells the system that the current market will go up or down?
The trading conditions we can choose are:
A buy (Long) signal is triggered whenever the market has closed at a round level while the previous closing prices have been above it.
A sell (Short) signal is triggered whenever the market has closed at a round level while the previous closing prices have been below it.
def signal(Data, close, psychological_col, buy, sell):

    for i in range(len(Data)):

        if Data[i, psychological_col] == 1 and Data[i, close] < Data[i - 1, close] and \
           Data[i, close] < Data[i - 2, close] and \
           Data[i, close] < Data[i - 3, close] and \
           Data[i, close] < Data[i - 4, close]:

               Data[i, buy] = 1

        elif Data[i, psychological_col] == 1 and Data[i, close] > Data[i - 1, close] and \
           Data[i, close] > Data[i - 2, close] and \
           Data[i, close] > Data[i - 3, close] and \
           Data[i, close] > Data[i - 4, close]:

               Data[i, sell] = -1

    return Data
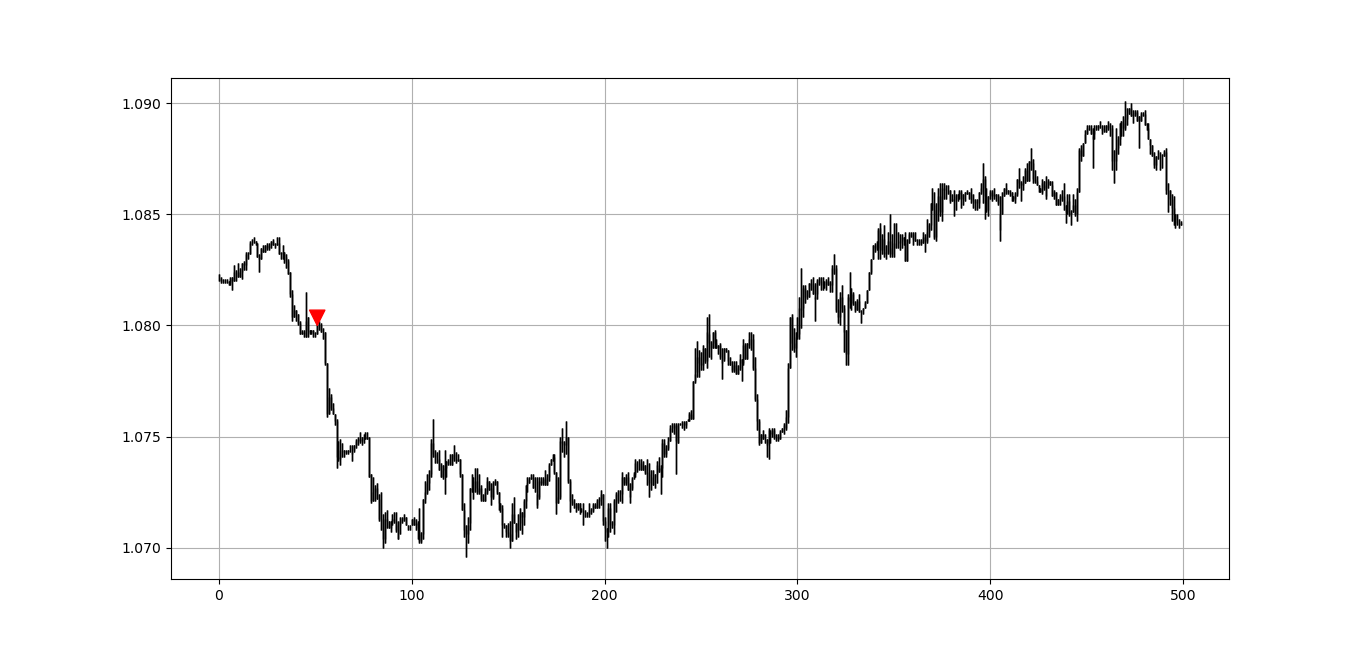
The above chart shows the values on the EURUSD through the hourly time frame. The green arrows show the bullish opportunities identified by the algorithm while the red arrows show the bearish opportunities identified by the algorithm.
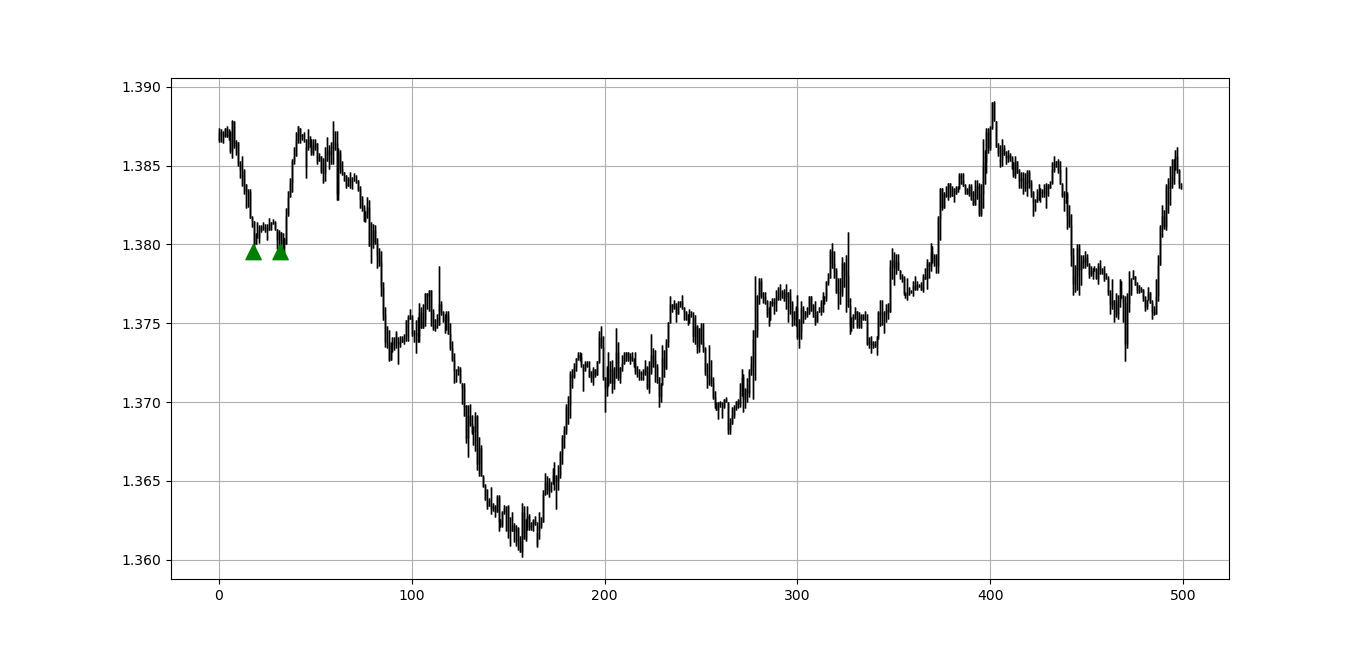
Some markets will have rare signals but this does not hinder the quality. The above example shows the GBPUSD hourly values. We can see that in the last 500 trading hours, we only had two signals which were pretty good. Remember, we are looking for short-term reactions.
Evaluating the Strategy
Having had the signals, we now know when the algorithm would have placed its buy and sell orders, meaning, that we have an approximate replica of the past where can can control our decisions with no hindsight bias. We have to simulate how the strategy would have done given our conditions. This means that we need to calculate the returns and analyze the performance metrics. Let us see a neutral metric that can give us somewhat a clue on the predictability of the indicator or the strategy. For this study, we will use the Signal Quality metric.
The signal quality is a metric that resembles a fixed holding period strategy. It is simply the reaction of the market after a specified time period following the signal. Generally, when trading, we tend to use a variable period where we open the positions and close out when we get a signal on the other direction or when we get stopped out (either positively or negatively).
Sometimes, we close out at random time periods. Therefore, the signal quality is a very simple measure that assumes a fixed holding period and then checks the market level at that time point to compare it with the entry level. In other words, it measures market timing by checking the reaction of the market.
def signal_quality(Data, closing, buy, sell, period, where):

    Data = adder(Data, 1)

    for i in range(len(Data)):
        try:

            if Data[i, buy] == 1:

                Data[i + period, where] = Data[i + period, closing] - Data[i, closing]
            if Data[i, sell] == -1:

                Data[i + period, where] = Data[i, closing] - Data[i + period, closing]
        except IndexError:
            pass
    return Data

my_data = signal_quality(my_data, 3, 6, 7, 21, 8)

positives = my_data[my_data[:, 8] > 0]
negatives = my_data[my_data[:, 8] < 0]

signal_quality = len(positives) / (len(negatives) + len(positives))
print('Signal Quality = ', round(signal_quality * 100, 2), '%')

# Output Signal Quality EURUSD = 53.82%
# Output Signal Quality USDCHF = 54.55%
# Output Signal Quality GBPUSD = 51.67%
With the most basic parameters and no optimization, we were able to obtain better than random signal quality (Above 50%). The strategy shows potential and in a later article, we will see how to combine it with technical indicators. Make sure to subscribe so you do not miss anything!
If you are also interested by more technical indicators and using Python to create strategies, then my best-selling book on Technical Indicators may interest you:
New Technical Indicators in Python
Amazon.com: New Technical Indicators in Python: 9798711128861: Kaabar, Mr Sofien: Bookswww.amazon.com
Conclusion
Remember to always do your back-tests. You should always believe that other people are wrong. My indicators and style of trading may work for me but maybe not for you.
I am a firm believer of not spoon-feeding. I have learnt by doing and not by copying. You should get the idea, the function, the intuition, the conditions of the strategy, and then elaborate (an even better) one yourself so that you back-test and improve it before deciding to take it live or to eliminate it. My choice of not providing specific Back-testing results should lead the reader to explore more herself the strategy and work on it more.
To sum up, are the strategies I provide realistic? Yes, but only by optimizing the environment (robust algorithm, low costs, honest broker, proper risk management, and order management). Are the strategies provided only for the sole use of trading? No, it is to stimulate brainstorming and getting more trading ideas as we are all sick of hearing about an oversold RSI as a reason to go short or a resistance being surpassed as a reason to go long. I am trying to introduce a new field called Objective Technical Analysis where we use hard data to judge our techniques rather than rely on outdated classical methods.