
Code the Pull-Back Trading Strategy
Coding the RSI Simple Pull-Back Strategy


Deploying strategies on the RSI is always interesting. This article presents a simple pull-back technique that does not require complex coding.
A Refresher on the RSI
First introduced by J. Welles Wilder Jr., the RSI is one of the most popular and versatile technical indicators. Mainly used as a contrarian indicator where extreme values signal a reaction that can be exploited. Typically, we use the following steps to calculate the default RSI:
Calculate the change in the closing prices from the previous ones.
Separate the positive net changes from the negative net changes.
Calculate a smoothed moving average on the positive net changes and on the absolute values of the negative net changes.
Divide the smoothed positive changes by the smoothed negative changes. We will refer to this calculation as the Relative Strength — RS.
Apply the normalization formula shown below for every time step to get the RSI.
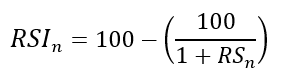
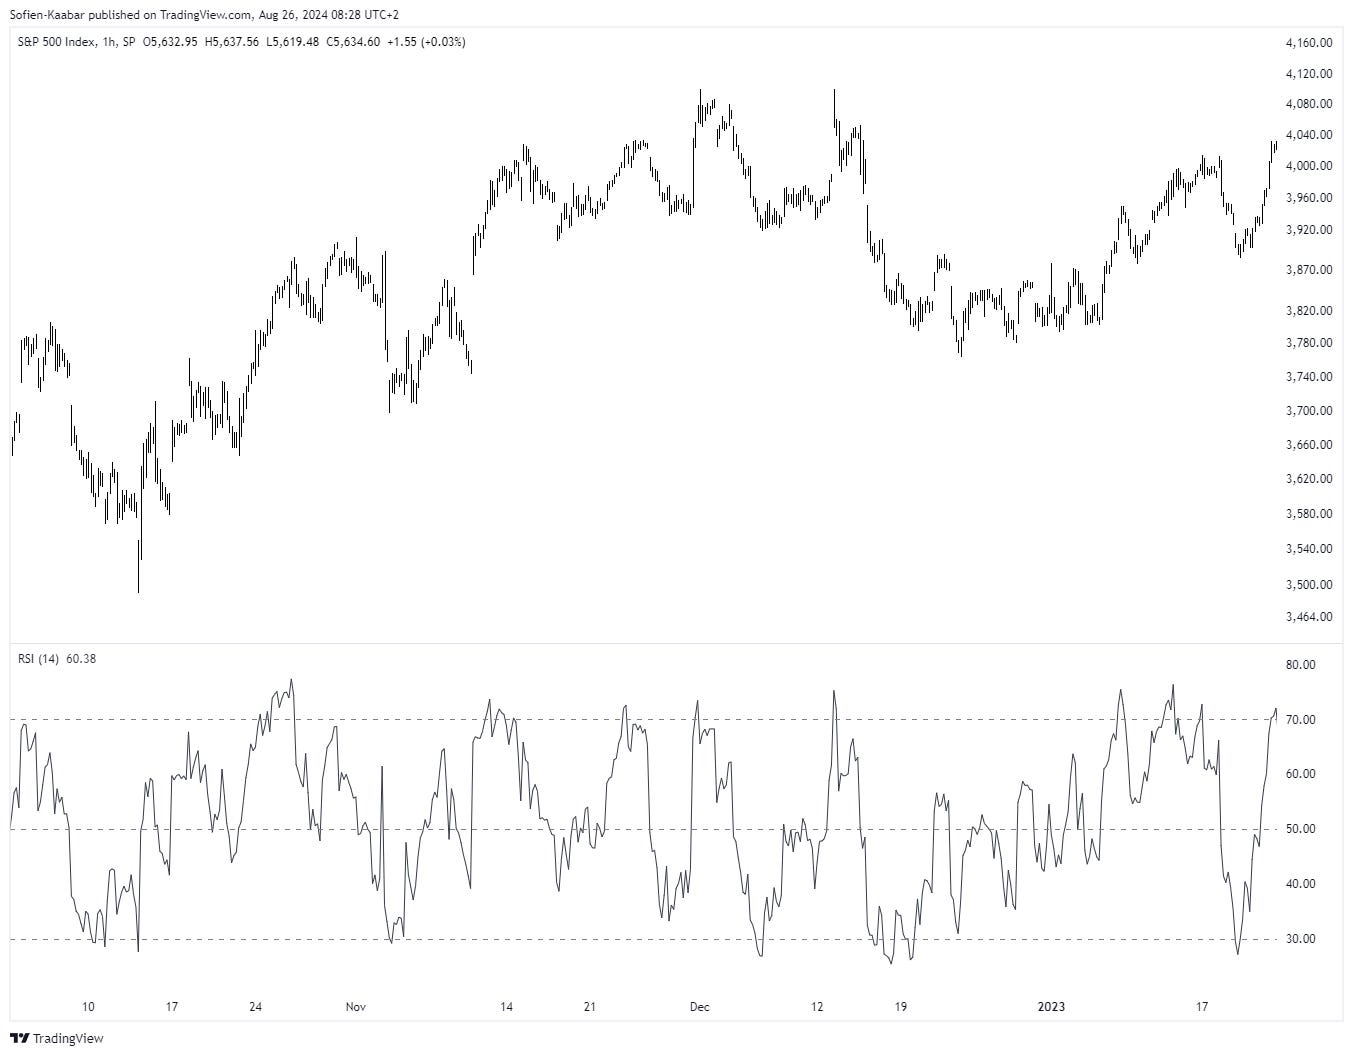
The next chart shows the RSI in TradingView with 30 and 70 as oversold and overbought levels respectively. Additionally, we can plot 50 as the middle line (or what is known as a neutrality level that splits bullish and bearish momentum).
The Signal Beyond 🚀
From classic tools that have stood the test of time to fresh innovations like multi-market RSI heatmaps, COT reports, seasonality, and pairs trading recommendation system, the new report is designed to give you a sharper edge in navigating the markets.
Free trial available.
Developing the Neutrality Pull-Back Technique
The strategy’s conditions relies on the pull-back concept which states that once an important level is broken, the market usually comes back to test it before continuing in the new direction. The trading strategy’s conditions are therefore:
A buy signal is generated whenever the RSI surpasses 50 but then pulls-back towards it without surpassing the threshold level of 53. At the same time, the close price must be above the 21-period moving average.
A sell signal is generated whenever the RSI breaks 50 but then pulls-back towards it without breaking the threshold level of 47. At the same time, the close price must be below the 21-period moving average.
// This source code is subject to the terms of the Mozilla Public License 2.0 at https://mozilla.org/MPL/2.0/
// © Sofien-Kaabar
//@version=5
indicator("The Neutrality Pullback Technique", overlay = true)
lookback_rsi = input(defval = 14, title = 'Lookback')
threshold = input(defval = 3, title = 'Threshold')
trend = input(defval = 21, title = 'Trend')
rsi = ta.rsi(close, lookback_rsi)
buy_signal = rsi[1] > 50 and rsi[1] < 50 + threshold and rsi[1] < rsi[2] and rsi[2] > 50 and rsi[3] < 50 and close > ta.sma(close, trend)
sell_signal = rsi[1] < 50 and rsi[1] > 50 - threshold and rsi[1] > rsi[2] and rsi[2] < 50 and rsi[3] > 50 and close < ta.sma(close, trend)
plotshape(buy_signal, style = shape.triangleup, color = color.blue, location = location.belowbar, size = size.small)
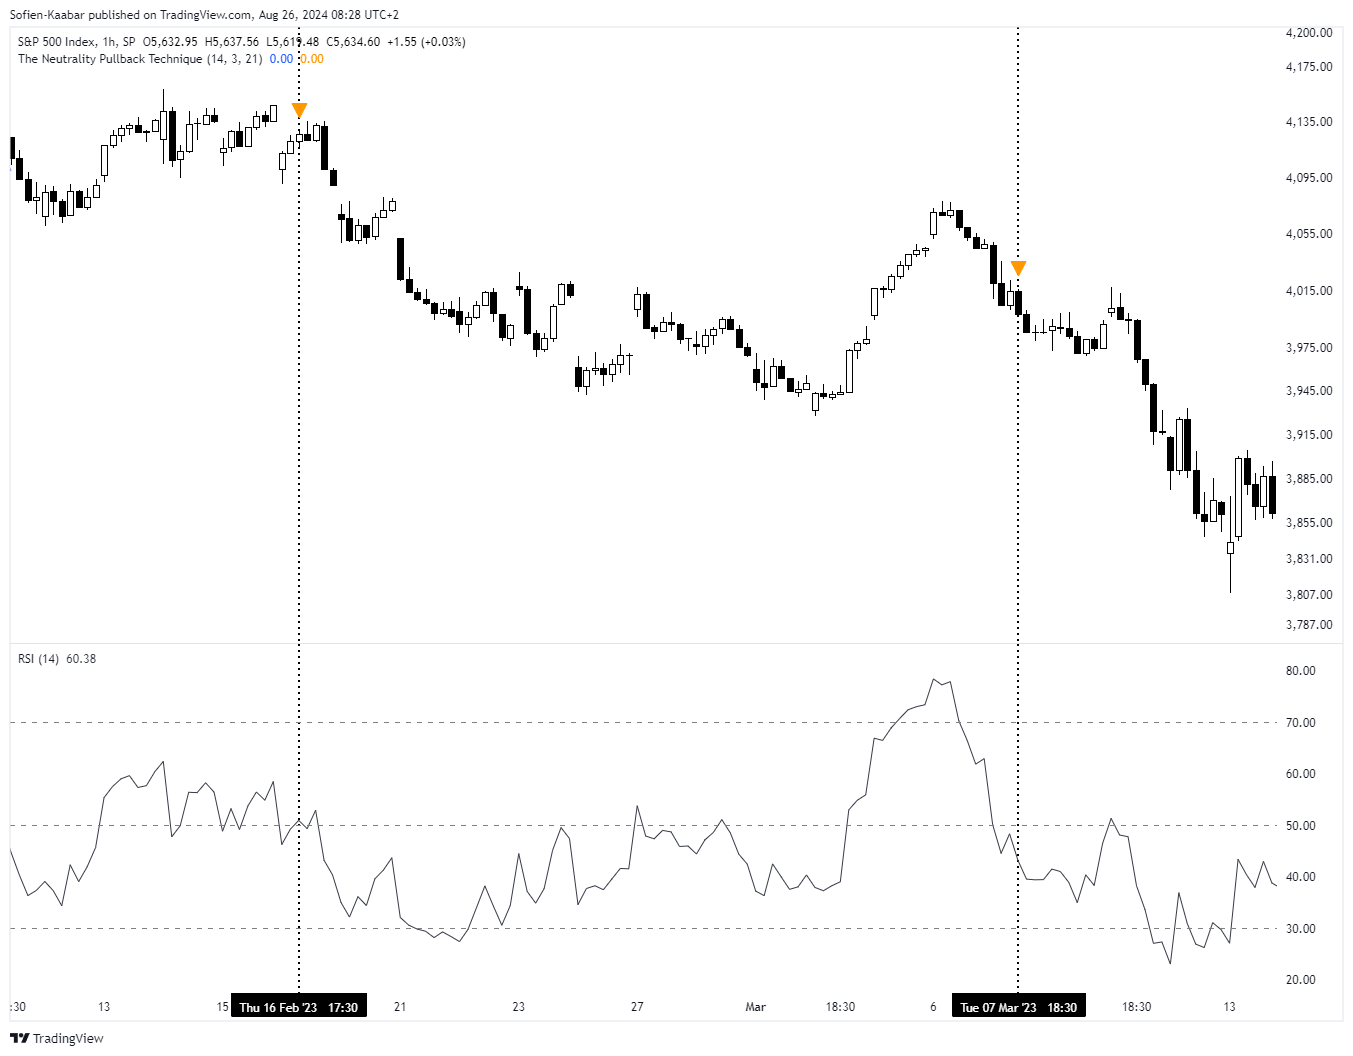
plotshape(sell_signal, style = shape.triangledown, color = color.orange, location = location.abovebar, size = size.small)The following shows how two bullish signals were generated.
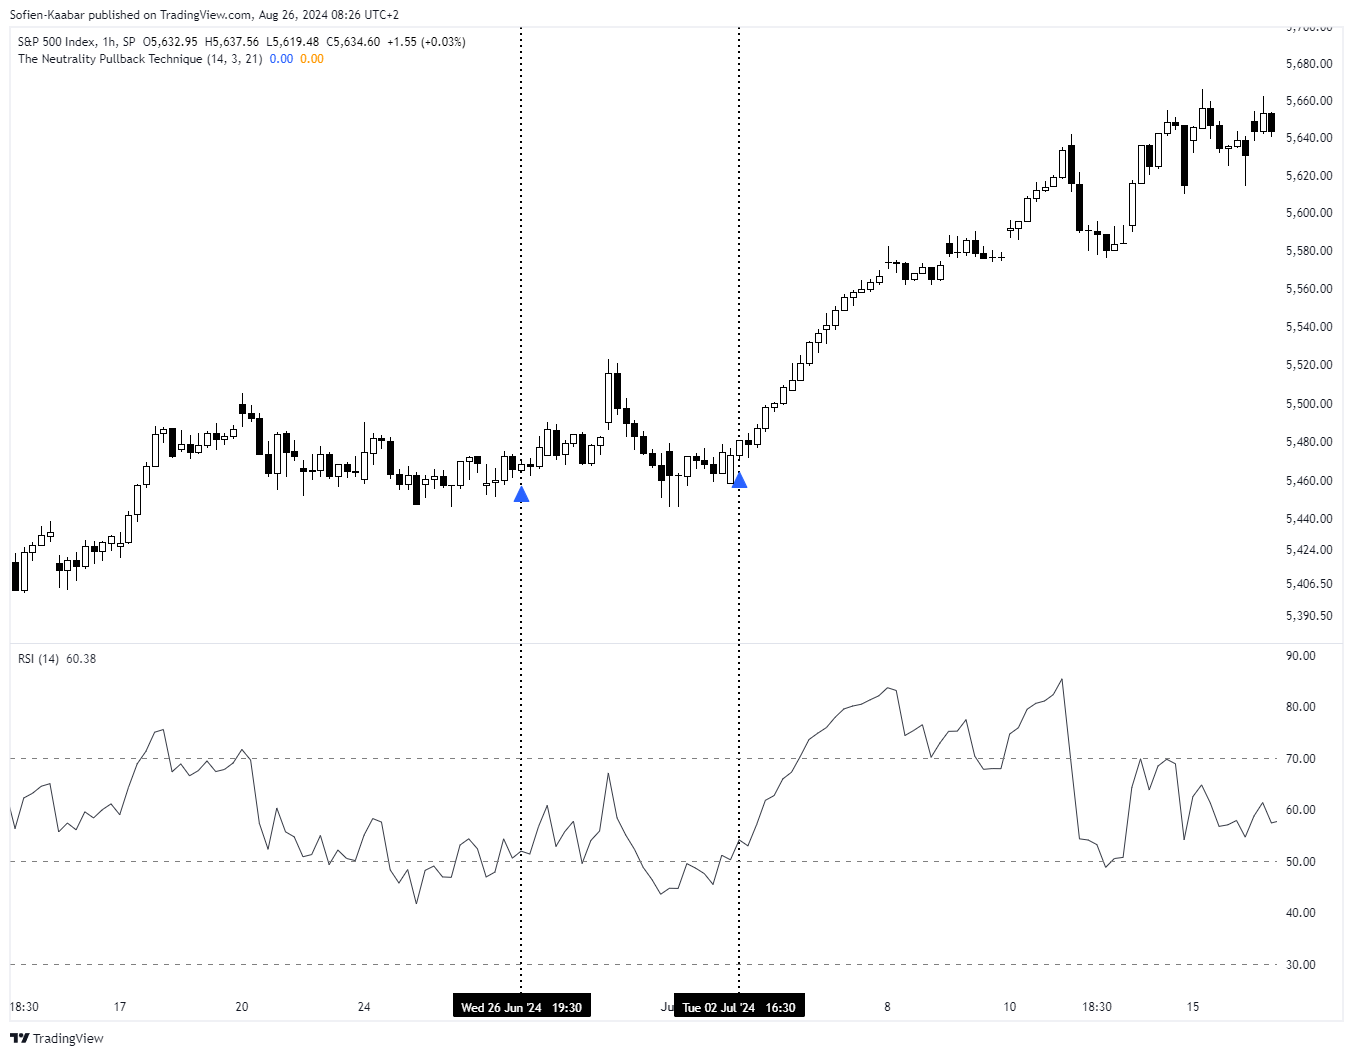
The following shows how two bearish signals were generated.
The RSI neutrality pull-back can also be used in tandem with the real price action pull-back technique which is where the market price exits a range, then re-tests its limit before continuing in the initial breakout direction.
Take a look at the next chart where the market exited the range in blue and shaped a pull-back to it.
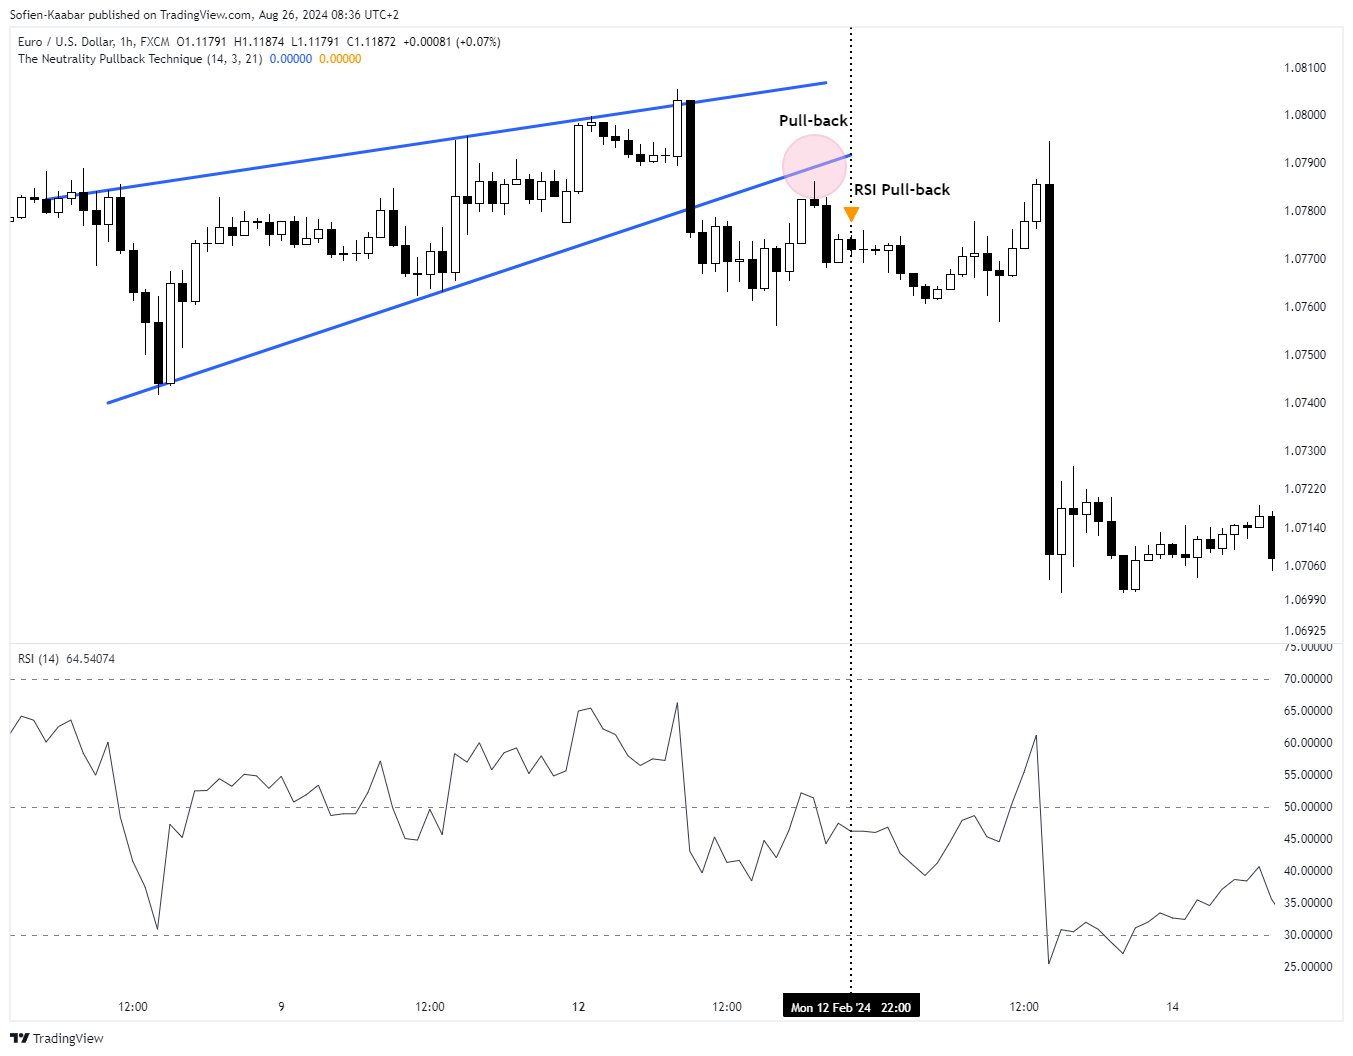
The technique adds a further confirmation factor, which may help with conviction.
Do you want to master Deep Learning techniques tailored for time series, trading, and market analysis🔥?
My book breaks it all down from basic machine learning to complex multi-period LSTM forecasting while going through concepts such as fractional differentiation and forecasting thresholds.
Get your copy here 📖!