
Chroma Technical Indicators I - Vanta
A Short Series on the Chroma Technical Indicators


Markets move through a constant push and pull between buyers and sellers. Every candle contains information: whether price broke higher, whether sellers pushed lower, whether the close showed strength, or whether momentum started to fade.
The role of an indicator is to take that raw market behavior and turn it into something easier to read.
Some indicators follow trends. Some measure volatility. Some track momentum. Others try to identify exhaustion points, where buying or selling pressure may have gone too far.
Vanta, from the Chroma Collection, falls into that last category.
It is a simple visual indicator that measures short-term upside and downside pressure, then prints signals when that pressure reaches an extreme. The result is a clean chart overlay with green and red triangles that can help traders spot possible turning points or stretched market conditions.
What Is Vanta?
Vanta is an indicator from the Chroma Collection designed to detect pressure imbalances in price action.
Instead of using a classic formula like RSI, MACD, or moving average crossovers, Vanta looks directly at recent candle behavior.
It asks a few simple questions:
Did the current high break above the previous high?
Did the current close finish above the previous open?
Did the current close finish below the previous open?
Did the current low break below the previous low?
Each answer contributes to either upside pressure or downside pressure. Vanta then looks back over the last 8 candles, compares the two sides, smooths the result with a short EMA, and prints a signal when the reading becomes stretched.
A green triangle below the candle marks a potential buy setup.
A red triangle above the candle marks a potential sell setup.
The idea is not that every signal predicts an immediate reversal. Instead, Vanta highlights moments where short-term pressure has reached an extreme level.
🚨🚨Get your Quant Atlas Free trial (no credit card required).
Sign up takes ~9 seconds before you have unconditional 10-day access to 100+ markets.
The Vanta Code
Here is the Pine Script code for Vanta:
// This source code is subject to the terms of the Mozilla Public License 2.0 at https://mozilla.org/MPL/2.0/
// © Sofien-Kaabar

//@version=5
indicator("Chroma Indicators - Vanta", overlay = true)

upside_pressure_max   = high > high[1]  ? 1 : 0
upside_pressure_min   = close > open[1] ? 1 : 0
downside_pressure_min = close < open[1] ? 1 : 0
downside_pressure_max = low < low[1]    ? 1 : 0

cumulative_upside_pressure = math.sum(upside_pressure_max, 8) + math.sum(upside_pressure_min, 8)
cumulative_downside_pressure = math.sum(downside_pressure_min, 8) + math.sum(downside_pressure_max, 8)

difference = cumulative_upside_pressure - cumulative_downside_pressure
vanta_indicator = ta.ema(difference, 3)

buy  = vanta_indicator < -10 and vanta_indicator[1] > -10
sell = vanta_indicator > 10 and vanta_indicator[1] < 10

plotshape(buy,  style = shape.triangleup,   color = color.green,  location =  location.belowbar, size = size.small)
plotshape(sell,  style = shape.triangledown, color = color.red,  location =  location.abovebar, size = size.small)
The logic is straightforward.
Vanta counts upside and downside pressure over an 8-bar window. Upside pressure increases when price breaks above the previous high or closes above the previous open. Downside pressure increases when price closes below the previous open or breaks below the previous low.
After that, the indicator subtracts downside pressure from upside pressure.
That gives us a pressure difference.
Then it smooths that difference using a 3-period EMA. This helps reduce noise without making the signal too slow.
The final signals come from two threshold levels:
A buy signal appears when the Vanta reading crosses below
-10.A sell signal appears when the Vanta reading crosses above
10.
On the chart, the buy signal is shown as a green triangle below price. The sell signal is shown as a red triangle above price.
Example 2: Buy Signal After Selling Pressure
In this first example, price has been moving lower. Several candles show downside pressure, and sellers appear to be in control.
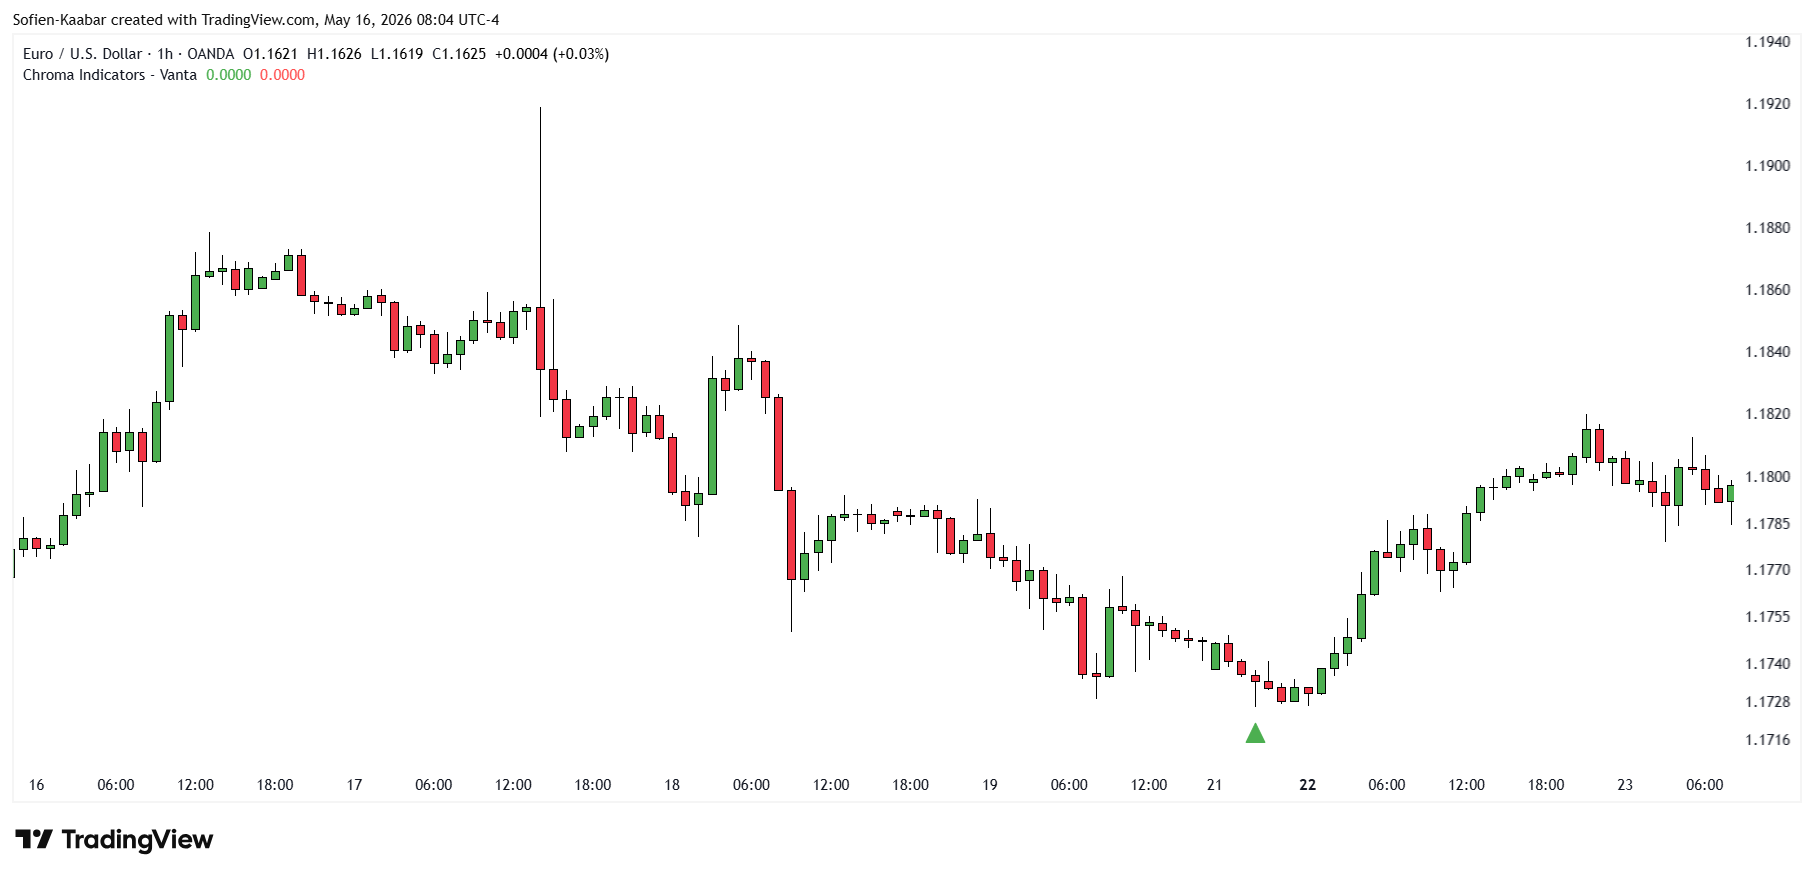
Then Vanta prints a green triangle below the candle.
This means the indicator has detected a stretched downside pressure reading. The market has moved far enough to the downside, based on Vanta’s internal pressure calculation, to trigger a potential buy signal.
This does not mean price must reverse immediately. A market can stay weak even after a buy signal appears.
But it does tell the trader something useful: selling pressure may be getting extended.
A trader could use this signal as a reason to slow down, watch for confirmation, and avoid shorting too late into a move. Confirmation might come from a bullish rejection wick, a break above a minor swing high, a support level holding, or a shift in market structure.
The signal is most useful when it appears in an area that already matters on the chart.
For example, a Vanta buy signal near support is more interesting than one printed in the middle of nowhere.
Example 2: Sell Signal After Buying Pressure
In the second example, price has been pushing higher. Buyers are active, candles are strong, and the market may look tempting for late long entries.
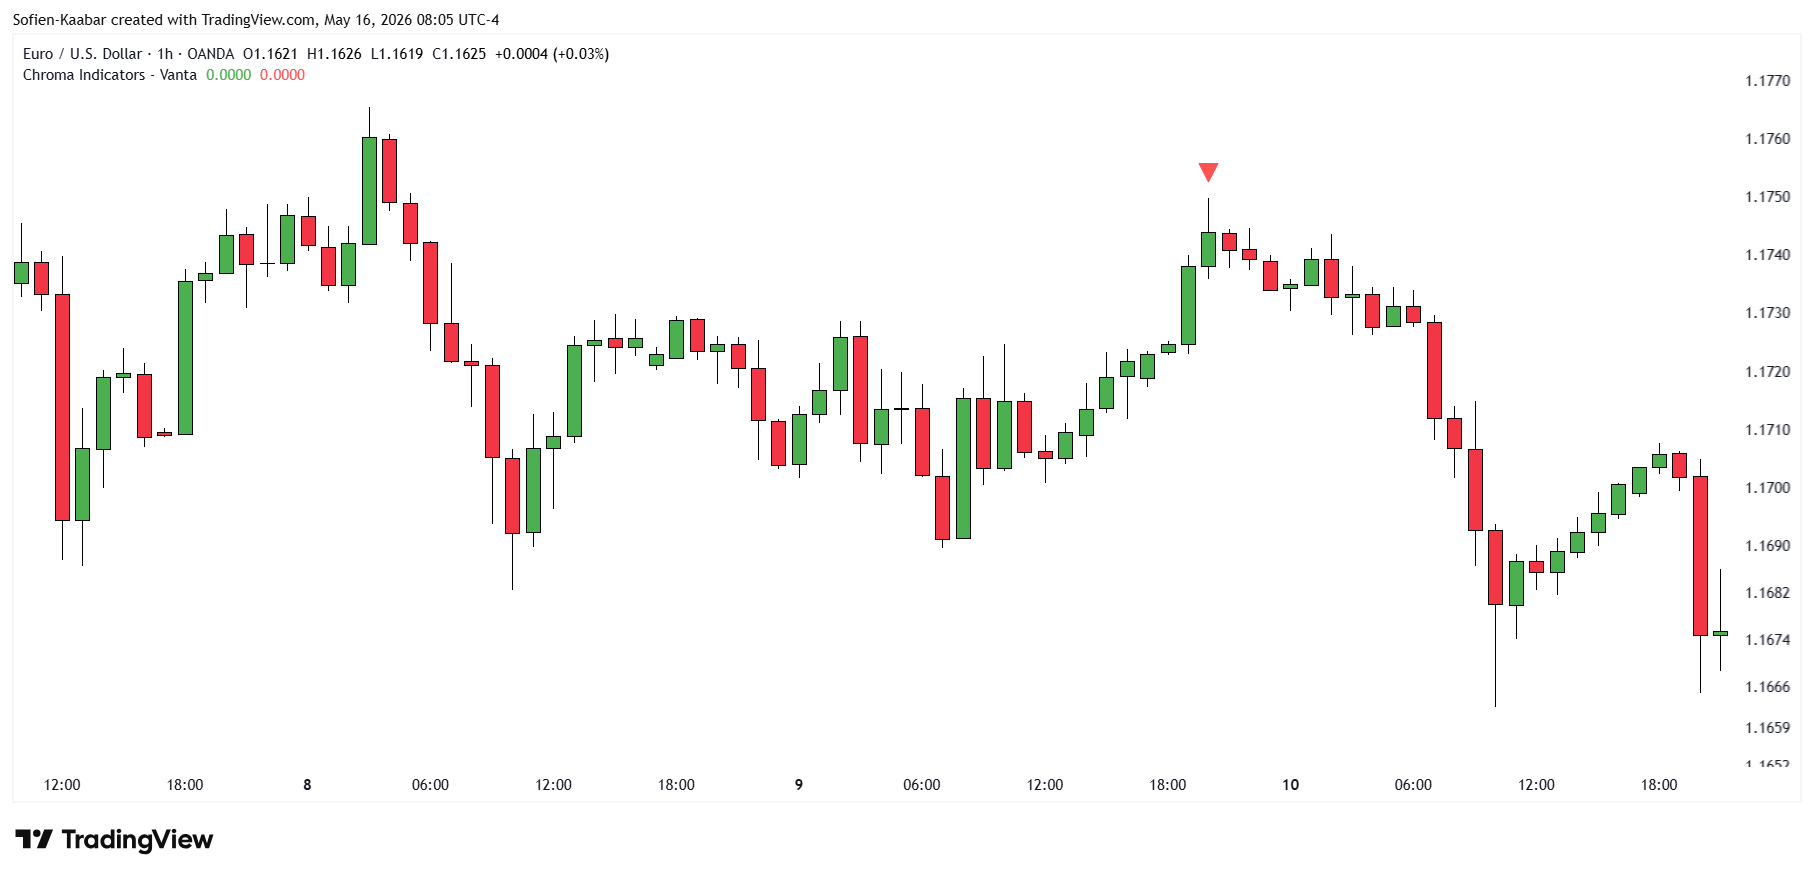
Then Vanta prints a red triangle above the candle.
This means upside pressure has reached an extreme reading according to the indicator.
Again, this is not an automatic short. Strong trends can continue after a sell signal. In fact, during powerful bull moves, sell signals can sometimes appear early.
But the signal still has value.
It can tell traders to be more cautious about chasing price. It can also help traders think about taking profits, tightening stops, or waiting for a pullback before entering.
A Vanta sell signal becomes more meaningful when it appears near resistance, after a fast rally, or when price is already showing signs of rejection.
Used this way, Vanta is less about predicting the future and more about managing behavior.
It helps traders avoid emotional entries after a market has already moved too far, too fast.
How Traders Can Use Vanta
Vanta is best used as a context tool.
The signal itself is simple, but the quality of the setup depends on where it appears.
A buy signal may be useful when it appears:
Near support
After a sharp selloff
During a pullback in an uptrend
After a liquidity sweep below recent lows
Alongside bullish candle confirmation
A sell signal may be useful when it appears:
Near resistance
After a fast rally
During a pullback in a downtrend
After a liquidity sweep above recent highs
Alongside bearish candle confirmation
The most important thing is not to treat every triangle the same way.
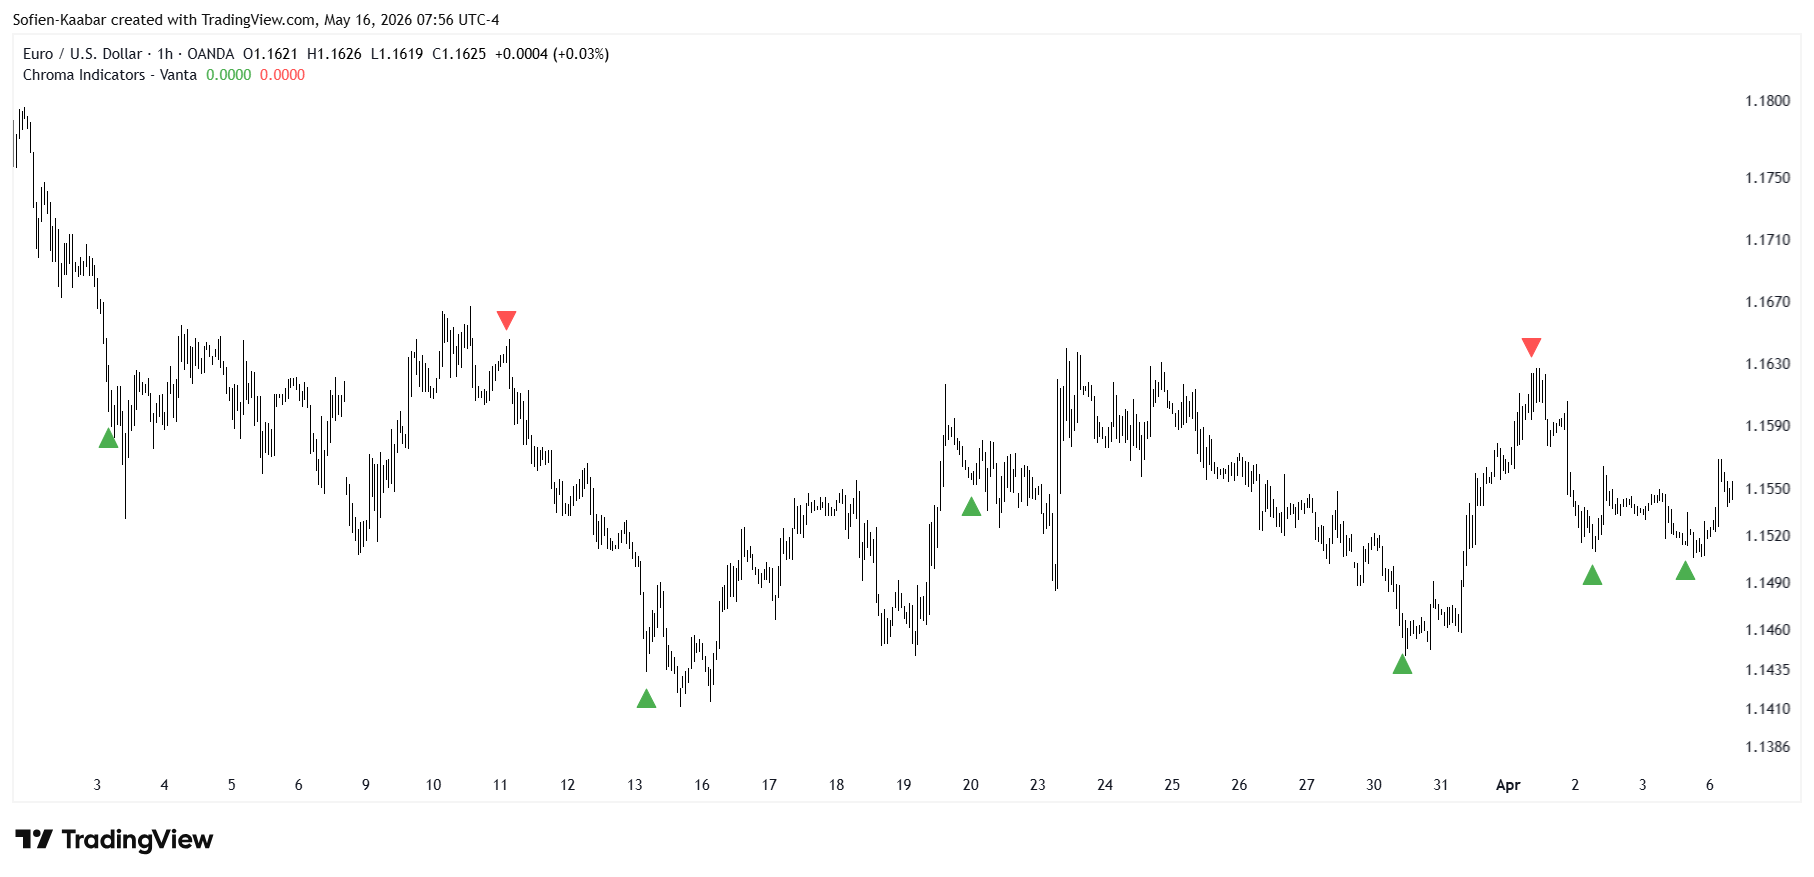
A buy signal against a strong downtrend is very different from a buy signal at support inside a larger uptrend.
A sell signal in a clean bull trend is very different from a sell signal at major resistance after a vertical rally.
Vanta gives the alert. The trader still needs to read the chart.
Pros and Cons of Vanta
Pros
Vanta is visually clean. It does not clutter the chart with multiple lines, bands, histograms, or labels. It simply prints a green or red triangle when its pressure reading reaches an extreme.
The logic is also easy to understand. It looks at candle behavior, compares upside and downside pressure, smooths the result, and signals stretched conditions.
Another strength is that Vanta can help traders avoid chasing. When a red triangle appears after a strong move up, it can remind traders that buying pressure may already be extended. When a green triangle appears after a selloff, it can warn that downside pressure may be stretched.
Cons
The main weakness is that Vanta can signal early.
This is common with exhaustion-style indicators. A market can become stretched and still continue in the same direction.
A buy signal does not guarantee a bottom. A sell signal does not guarantee a top.
Vanta also does not include a trend filter. That means it may give buy signals during strong downtrends and sell signals during strong uptrends. Traders need to add their own context, whether through market structure, higher-timeframe trend, support and resistance, or another confirmation tool.