
Chart Pattern Recognition in Python
Creating a Trading Pattern Recognition Strategy Using K’s Candlesticks

Candlestick patterns deserve to be studied thoroughly and even though a strategy relying solely on them will be unstable and unprofitable, they can be a valuable addition into a full trading system that uses other techniques. In this article, we will see a full presentation and code of the Doji pattern on an alternative charting system.
K’s Candlestick Chart
A simple transformation of candlestick charts that I have found to be useful lies with moving averages. To create the K’s Candlestick chart, we need to transform the prices using the simple moving average formula. The steps are relatively easy:
Calculate a 3-period SMA of the opening price.
Calculate a 3-period SMA of the high price.
Calculate a 3-period SMA of the low price.
Calculate a 3-period SMA of the close price.
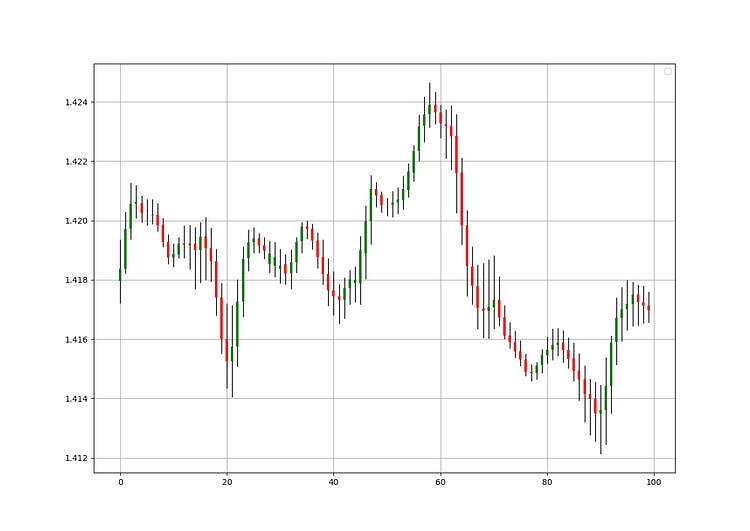
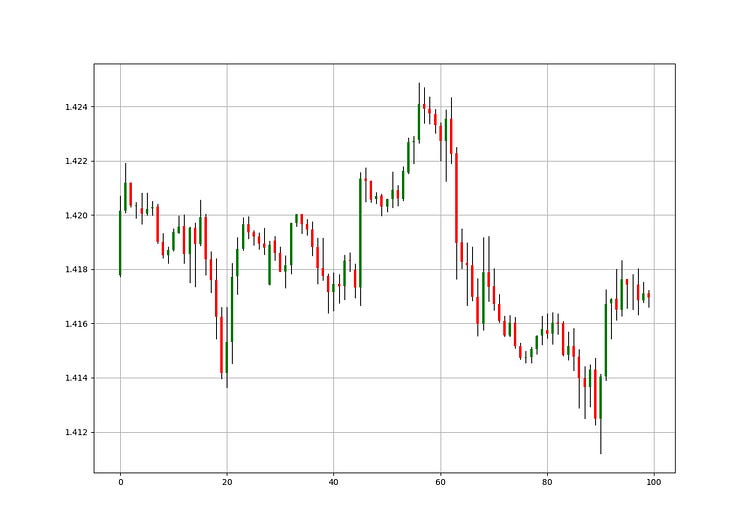
Then, we will treat the new four columns as the candlestick data while being careful from using them in trading as they are not real prices, but simple moving averages. We are interested in visually interpreting them and determining candlestick patterns which work better using this technique. The charts below show the difference between the normal candlestick chart and the K’s candlestick chart.


The above charts show the EURUSD charted differently. We can notice how smoother the K’s candlestick chart is compared to the noisy regular chart. By noisy, the meaning here is on the interpretability of the trend. When successive red or green candles are observed, the trend is easier to be determined.

We can tweak the lookback period of the moving average, but I recommend 2 or 3 lookback periods.
It becomes clear that we are interested in two things when analyzing the market using K’s Candlesticks:
Interpretability of the trend: Similar to the Heikin-Ashi, the K’s Candlestick chart smoothes out the data in order to remove the short-term noise and to deliver a clearer picture of the current trend.
Pattern Recognition: Doji and exhaustion patterns are more prevalent in the K’s candlesticks and therefore add a confirmation factor. They also work better than in regular charts according to my experience.
Check out my newsletter that sends weekly directional views every weekend to highlight the important trading opportunities using a mix between sentiment analysis (COT report, put-call ratio, etc.) and rules-based technical analysis.

The K’s Doji
The bullish Doji pattern is composed of a candle that has its closing price equal to its opening price. It usually occurs after downward trending price action and is considered a bullish reversal or a correction pattern.

The bullish Doji pattern is based on the psychology that the balance of power has been equalized after trending in one direction. Theoretically, we are supposed to buy at the close of the second and last candle to validate the pattern. For a bullish Doji pattern to be valid, we need a bullish candle after it.
The bearish Doji pattern is composed of a candle that has its closing price equal to its opening price. It usually occurs after upward trending price action and is considered a bearish reversal or a correction pattern.

The bearish Doji pattern is based on the psychology that the balance of power has been equalized after trending in one direction. Theoretically, we are supposed to sell at the close of the second and last candle to validate the pattern. For a bearish Doji pattern to be valid, we need a bearish candle after it.
Creating a Scanning Algorithm
Our aim is to create an algorithm that detects this pattern and places theoretical buy and sell orders. But first, we need to code the intuition of the pattern. Let us review what we will need for the bullish Doji pattern:
The K’s closing price equals the K’s opening price.
The current close is below the last close and the one prior to it.
The previous candle is not a Doji.
Similarly, for the bearish Doji pattern, we need the following conditions:
The K’s closing price equals the K’s opening price.
The current close is above the last close and the one prior to it.
The previous candle is not a Doji.


The red arrows point to a sell short signal while the green arrows point to a buy signal based on the closing prices.