


Can we RSI the MACD?
Applying the MACD Formula on the RSI Values in Pine Script


The MACD and the RSI are icons in terms of technical analysis, but is there a way (among many) to fuse these two? We’ll see one of these ways in this article.
The MACD in a Nutshell
The MACD is a momentum and trend-following indicator that shows the relationship between two exponential moving averages (EMA). It is widely used because it captures both momentum and trend direction in a relatively simple mathematical framework. Created by Gerald Appel in the late 1970s, the MACD remains a core tool in technical analysis.
The idea is to track the difference between two EMAs — a faster one that reacts quickly to price changes and a slower one that reacts more gradually. This difference reflects how the short-term market behavior is diverging or converging from the longer-term behavior.
We begin with the price series P, typically the closing price. Two exponential moving averages are calculated:
A fast EMA of length n (commonly 12).
A slow EMA of length n (commonly 26).
These are calculated using the EMA formula:

The MACD line is then defined as:

This value shows how much the short-term price is diverging from the longer-term trend. Next, a signal line is calculated — this is simply a smoothing of the MACD line itself, typically using a 9-period EMA:

Finally, the histogram is the difference between the MACD line and the Signal line:

This histogram is a visual measure of the momentum strength. When it grows in the positive direction, momentum is increasing in the direction of the trend; when it shrinks, the trend is weakening.

The MACD encapsulates trend and momentum information in a compact formula. It is not only a moving average system but also a dynamic gauge of the rate of price change. Its foundation in exponential moving averages makes it responsive yet smooth enough to avoid excessive noise. The histogram, crossovers, and zero-line interactions together make it a flexible tool for both confirmation and signal generation.
The RSI in a Nutshell
The relative strength index (RSI), developed by J. Welles Wilder Jr. in 1978, is a momentum oscillator designed to measure the speed and magnitude of recent price changes. It captures whether a security is overbought or oversold, providing insight into potential reversal zones or confirmation of trends. Unlike the MACD, which is unbounded and centered around zero, RSI is bounded between 0 and 100, which makes it ideal for identifying extremes in price movement.
The RSI’s core concept is simple: compare average gains to average losses over a specified lookback period, usually 14 periods. If prices have mostly risen during that period, the RSI moves toward 100; if they’ve mostly fallen, the RSI approaches 0.
To construct the RSI, we begin with the basic notion of relative strength — not in a physical sense, but the ratio of bullish to bearish movement in price. Given a series of closing prices P, we compute the price change:

This change is decomposed into two parts:
The upward move (gain).
The downward move (loss).
These values are then smoothed, not simply averaged. Wilder used a type of exponential smoothing in his original formulation, which is a recursive formula similar to EMA:
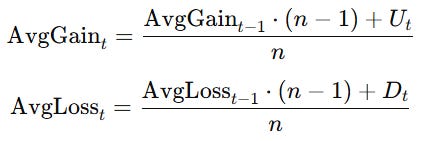
With these averages, we define the relative strength (RS):
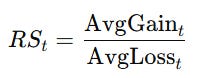
Finally, the RSI itself is calculated by normalizing RS into a 0–100 range:

This formulation ensures that when gains dominate, RS > 1 and RSI moves toward 100; when losses dominate, RS < 1 and RSI falls toward 0.

The RSI is traditionally used to identify overbought or oversold conditions. The key levels are:
RSI > 70: asset may be overbought.
RSI < 30: asset may be oversold.
However, interpreting RSI requires more than just these thresholds.
First, let’s consider what "overbought" and "oversold" truly mean. Overbought does not mean the price will immediately fall — it means the price has risen strongly, and a correction could be near. Likewise, oversold means a strong decline has occurred, not that a rebound is guaranteed. In strong trends, RSI can stay overbought or oversold for long periods. This is where RSI becomes more useful in confirming momentum rather than calling reversals. For example, if RSI remains above 70 during an uptrend, it confirms strength — not necessarily a reason to sell.
Applying the MACD Formula Using RSI Values
Sometimes, tweaking the formulas of the classic indicators can yield some alternative ideas and signals. This technique is very simple. We will apply the MACD’s formula using RSI values instead of the close price. Therefore, the code in Pine Script will look like this:
//@version=6
indicator("RSI-MACD Indicator", overlay=false)

// === INPUTS === //
fastLength   = input.int(12, title="Fast EMA Length")
slowLength   = input.int(26, title="Slow EMA Length")
signalLength = input.int(9, title="Signal EMA Length")
src          = input.source(close, title="Source")

// === MACD CALCULATION === //
fastEMA = ta.ema(ta.rsi(close, 14), fastLength)
slowEMA = ta.ema(ta.rsi(close, 14), slowLength)
macdLine = fastEMA - slowEMA
signalLine = ta.ema(macdLine, signalLength)
histogram = macdLine - signalLine

// === PLOT MACD COMPONENTS === //
plot(macdLine, color=color.blue, title="MACD Line", linewidth=2)
plot(signalLine, color=color.orange, title="Signal Line", linewidth=2)
plot(histogram, style=plot.style_columns, color=(histogram >= 0 ? color.green : color.red), title="Histogram")

// === ZERO LINE === //
hline(0, "Zero Line", color=color.gray)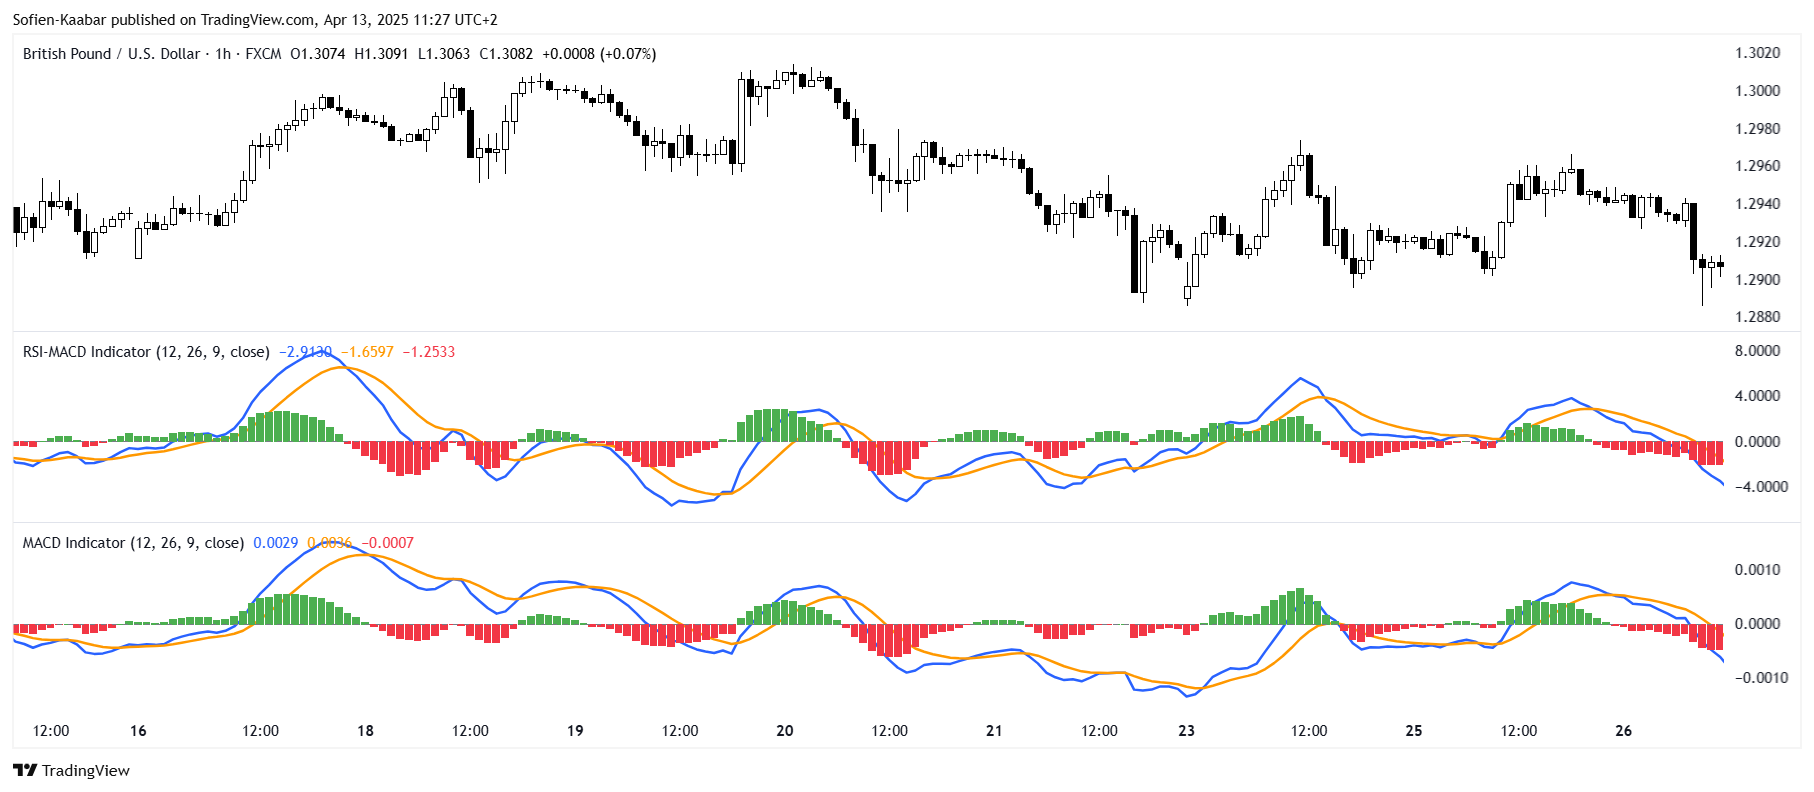
The above chart shows the difference between the RSI-MACD and the regular MACD (in the lower panel). At first glance, there is not a big difference, but sometimes small differences can yield big changes in results.
Using the RSI-MACD can be done through the following ways:
A bullish signal is generated whenever the short line crosses above the long line while above zero.
A bearish signal is generated whenever the short line crosses under the long line while below zero.
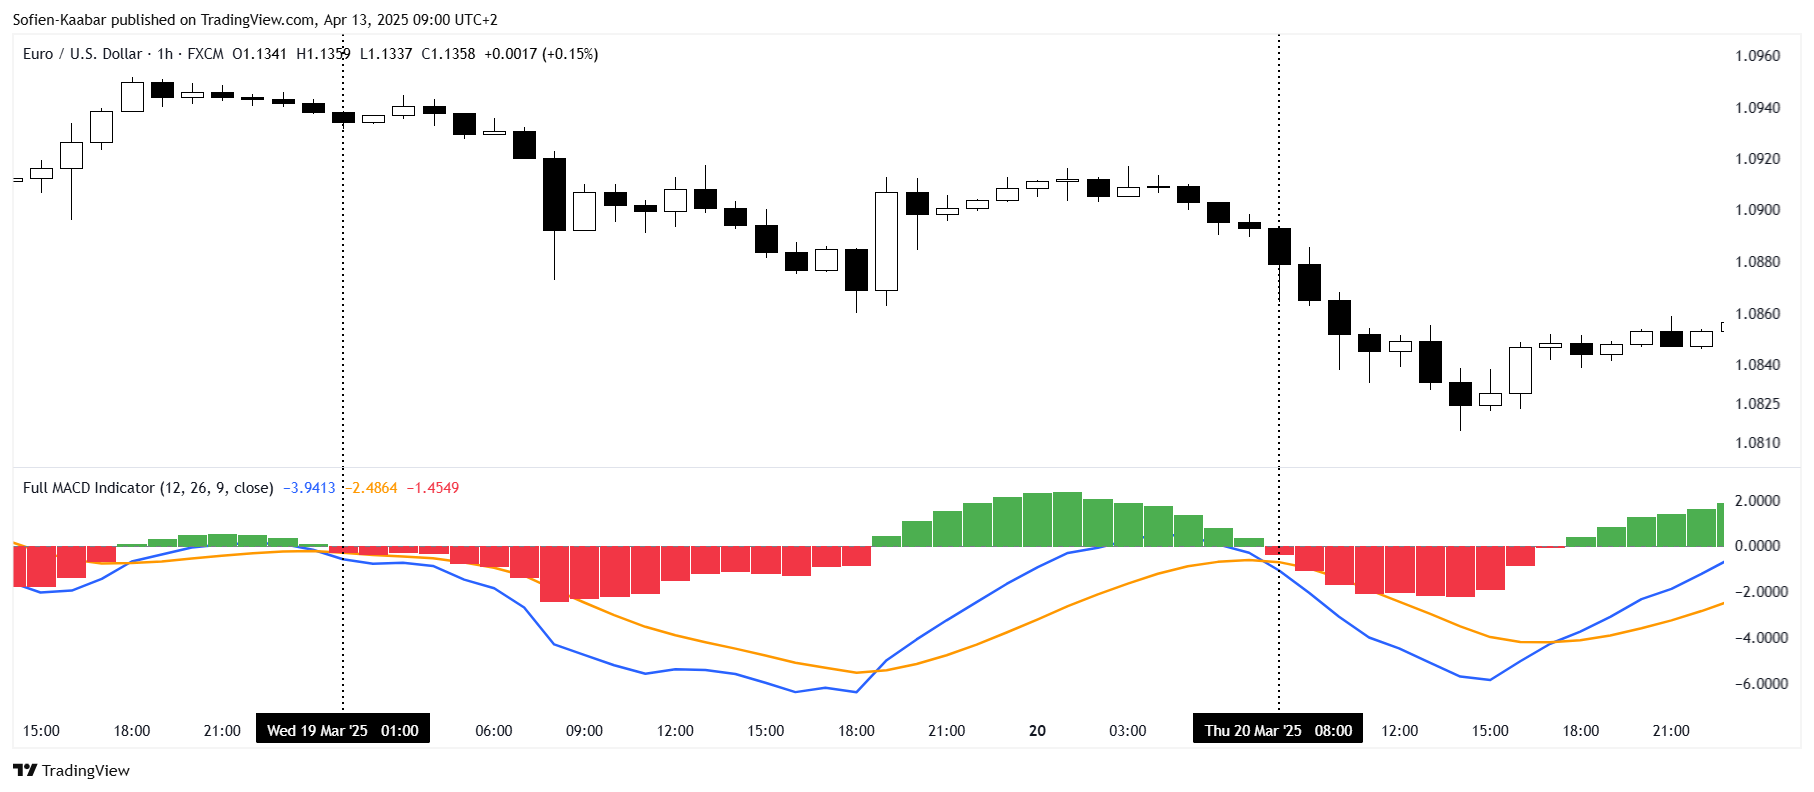
The following chart shows a bullish signal.

The following chart shows a bearish signal.
Check out my newsletter that sends weekly directional views every weekend to highlight the important trading opportunities using a mix between sentiment analysis (COT report, put-call ratio, etc.) and rules-based technical analysis.
