
Can Correlation Improve Technical Indicators' Signals?
Using Correlation to Filter Signals from the RSI


Using a technical indicator to predict reversals is one of technical analyses’ usages. We assume that the indicator’s movements are fairly predictable, but we also assume that there is a very strong correlation between the indicator and the underlying asset. Therefore, when we are able to predict the indicator’s moves, we should be able to predict the markets moves. However, correlation is not always perfect, and can be chaotic.
Correlation can be cyclical, it can range from high to low in an oscillatory move. This article will leverage this piece of information and will try to present a technique that theoretically improves the signals generated from an indicator.
Correlation in a Nutshell
Correlation measures the strength and direction of a relationship between two variables. For time series, it's used to understand how current values relate to past or future values — either within the same series or between two different ones. In time series analysis, correlation helps us understand how data points are related across time.
Unlike regular correlation, which deals with static variables, time series correlation involves data that are ordered in time, making the relationships potentially more complex. For instance, we might want to know whether today’s temperature is related to yesterday’s, or whether two different time-based variables (like sales and advertising spend) move together over time.
Take a look at the following chart which shows EURUSD (black) versus EURNZD (brown) with their rolling 20-period correlation in blue.

Notice how correlation fluctuates between -1.00 and 1.00 in a cyclical move. It seems that structural decorrelation may occur from time to time where strong positive correlation becomes strong negative correlation.
Every week, I analyze positioning, sentiment, and market structure. Curious what hedge funds, retail, and smart money are doing each week? Then join hundreds of readers here in the Weekly Market Sentiment Report 📜 and stay ahead of the game through chart forecasts, sentiment analysis, volatility diagnosis, and seasonality charts.
Free trial available🆓.

The RSI in a Nutshell
The relative strength index (RSI), developed by J. Welles Wilder Jr. in 1978, is a momentum oscillator designed to measure the speed and magnitude of recent price changes. It captures whether a security is overbought or oversold, providing insight into potential reversal zones or confirmation of trends. Unlike the MACD, which is unbounded and centered around zero, RSI is bounded between 0 and 100, which makes it ideal for identifying extremes in price movement.
The RSI’s core concept is simple: compare average gains to average losses over a specified lookback period, usually 14 periods. If prices have mostly risen during that period, the RSI moves toward 100; if they’ve mostly fallen, the RSI approaches 0.
To construct the RSI, we begin with the basic notion of relative strength — not in a physical sense, but the ratio of bullish to bearish movement in price. Given a series of closing prices P, we compute the price change:

This change is decomposed into two parts:
The upward move (gain).
The downward move (loss).
These values are then smoothed, not simply averaged. Wilder used a type of exponential smoothing in his original formulation, which is a recursive formula similar to EMA:
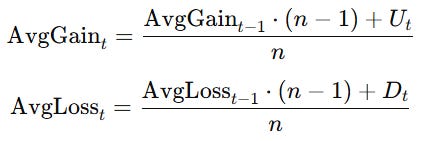
With these averages, we define the relative strength (RS):
Finally, the RSI itself is calculated by normalizing RS into a 0–100 range:

This formulation ensures that when gains dominate, RS > 1 and RSI moves toward 100; when losses dominate, RS < 1 and RSI falls toward 0.

The RSI is traditionally used to identify overbought or oversold conditions. The key levels are:
RSI > 70: asset may be overbought.
RSI < 30: asset may be oversold.
However, interpreting RSI requires more than just these thresholds.
First, let’s consider what "overbought" and "oversold" truly mean. Overbought does not mean the price will immediately fall — it means the price has risen strongly, and a correction could be near. Likewise, oversold means a strong decline has occurred, not that a rebound is guaranteed.
In strong trends, RSI can stay overbought or oversold for long periods. This is where RSI becomes more useful in confirming momentum rather than calling reversals. For example, if RSI remains above 70 during an uptrend, it confirms strength — not necessarily a reason to sell.
Filtering the RSI’s Signals With Correlation
The hypothesis is simple, whenever there is a signal from the RSI, we check the 200-period rolling correlation between the close price and the 14-period RSI, if it’s at extreme lows, then the cyclical nature tells us that the correlation will go up, and therefore quite possibly, the market and the RSI should move in the same direction. Here’s how to think of this algorithmically:
A bullish signal is generated whenever the correlation is below 0 and the RSI is below 30.
A bearish signal is generated whenever the correlation is below 0 and the RSI is above 70.
// This Pine Script® code is subject to the terms of the Mozilla Public License 2.0 at https://mozilla.org/MPL/2.0/
// © Sofien-Kaabar

//@version=6
indicator("My script", overlay=true)
// Correlation
corr = ta.correlation(close, ta.rsi(close, 14), 200)
rsi = ta.rsi(close, 14)
buy  = corr < 0.0 and rsi < 30
sell = corr < 0.0 and rsi > 70
plotshape(buy,  style = shape.triangleup, color = color.green, location =  location.belowbar, size = size.small)
plotshape(sell,  style = shape.triangledown, color = color.red, location =  location.abovebar, size = size.small)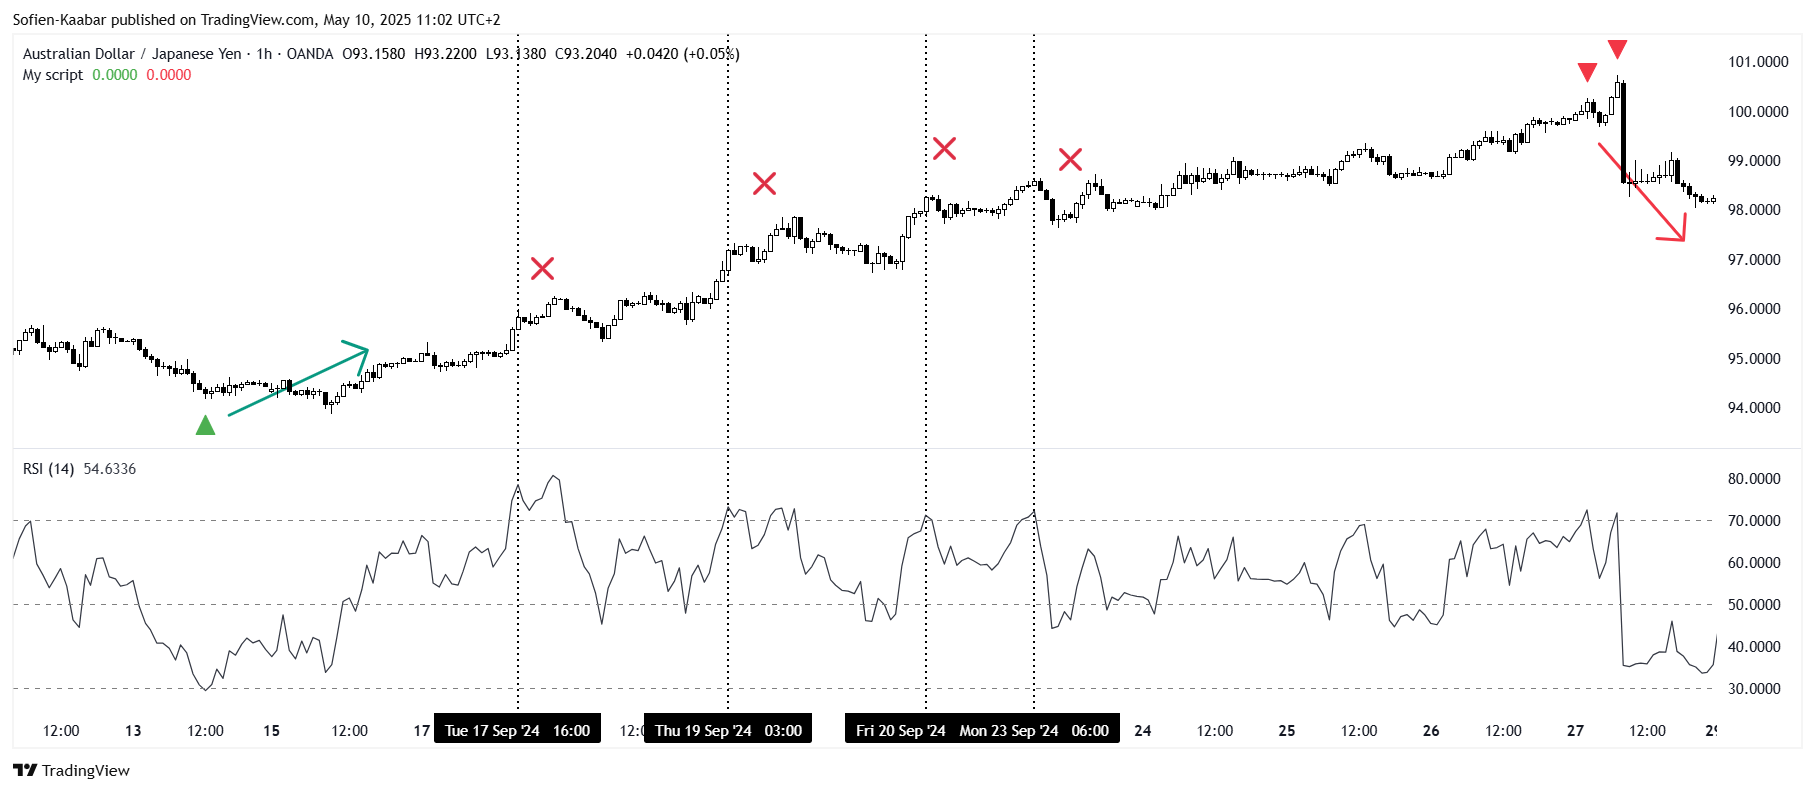
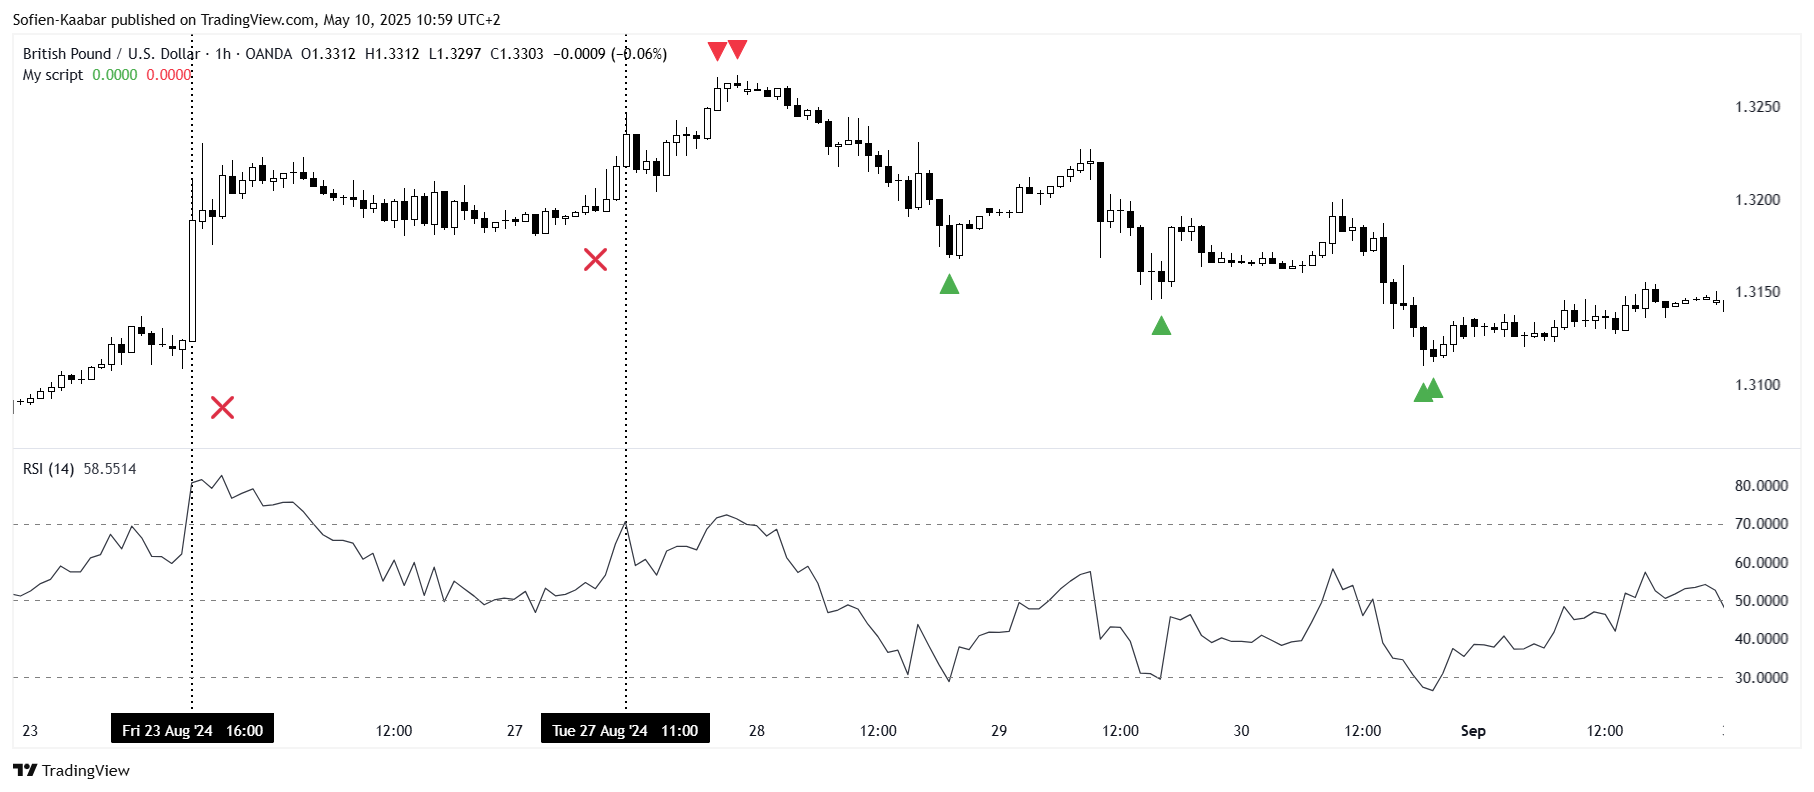
The charts above and below show the filtered signals. When there’s an arrow it means that the RSI signal has been taken (considering the correlation condition). The vertical dashed line shows RSI signals without taking into account the correlation condition.
Do you want to master Deep Learning techniques tailored for time series, trading, and market analysis🔥? My book breaks it all down from basic machine learning to complex multi-period LSTM forecasting while going through concepts such as fractional differentiation and forecasting thresholds. Get your copy here 📖!