Bullish and Bearish Price Action — Forecast The Next Market Move
Presenting and Coding This Configuration in TradingView
Markets are a mix between psychology, supply, demand, randomness, and anything in-between. Historical observations are most likely what we have to try to predict what may come next. This article discusses a simple (and old) technique that signal a continuation of a trend.
Introduction to Candlesticks
Candlesticks are a fundamental tool used in technical analysis to analyze and interpret price movements in financial markets, such as stocks, currencies, commodities, and more. They provide valuable insights into the psychology of market participants and help traders and investors make informed decisions.
A candlestick consists of four main components: the open, close, high, and low prices for a specific time period, such as a day, week, or month. These components are represented graphically as a rectangular shape with a thin vertical line on top and/or bottom, resembling a candlestick. The body of the candlestick represents the price range between the open and close prices, while the vertical lines, known as “wicks” or “shadows,” extend above and below the body to show the high and low prices during that period.
Candlesticks come in various colors, typically green or white for bullish (positive) candles and red or black for bearish (negative) candles. The color coding depends on whether the close price is higher or lower than the open price. A green or white candle indicates that the close price was higher than the open, suggesting bullish sentiment, while a red or black candle signifies that the close was lower than the open, signaling bearish sentiment.
You can also check out my other newsletter The Weekly Market Sentiment Report that sends tactical directional views every weekend to highlight the important trading opportunities using a mix between sentiment analysis (COT reports, Put-Call ratio, Gamma exposure index, etc.) and technical analysis.
Bullish and Bearish Price Action
Bullish and bearish price actions are names for extra large candlesticks that are supposed to wipe out stops and other orders in order to reinforce the trend in the direction of the candle. Here’s how it goes:
A bullish price action is composed of a large bullish candlestick that signals more demand to come, and thus a bullish scenario to follow.
A bearish price action is composed of a large bearish candlestick that signals more supply to come, and thus a bearish scenario to follow.
In the context of coding these price actions, we’ll define the word large as having a candle body (high minus low or close minus open in absolute terms) bigger than the biggest body for the past 100 periods.
The following chart shows a few bullish price action candles (in green arrows):
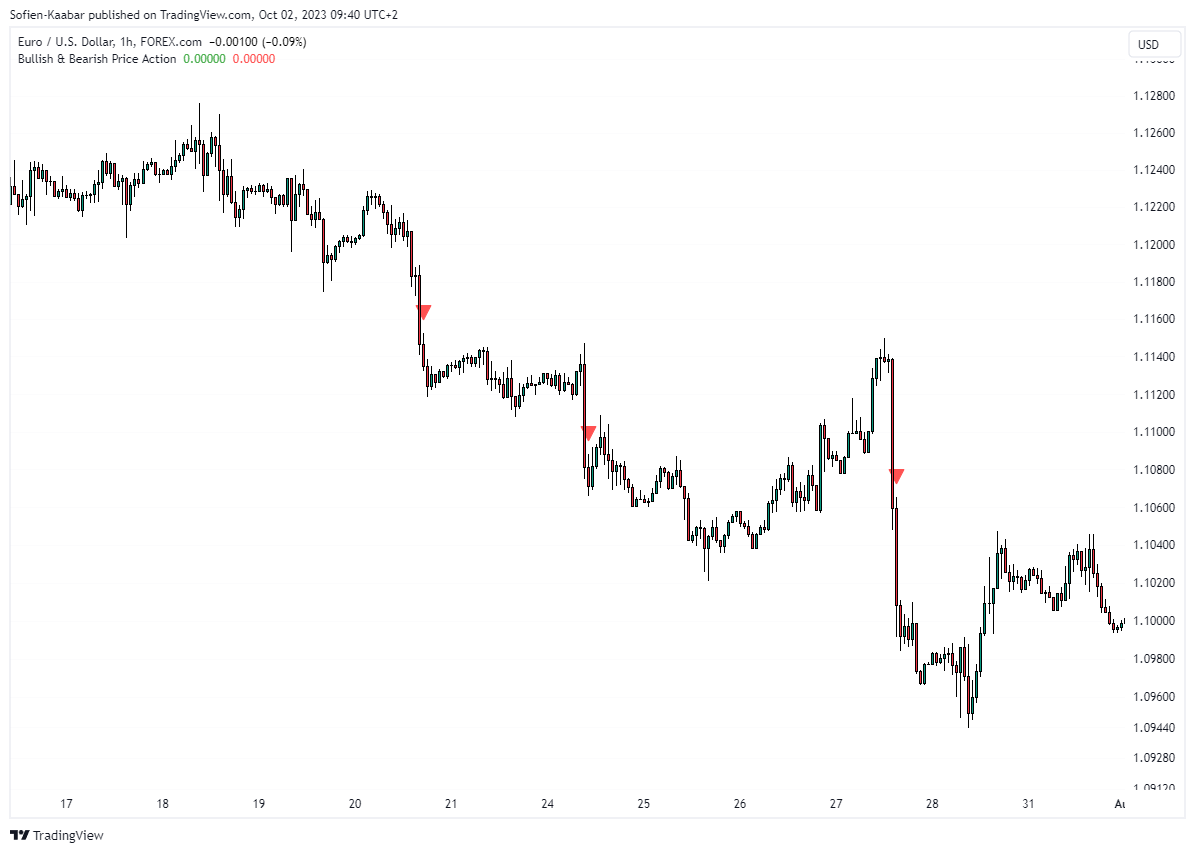
The following chart shows a few bearish price action candles (in red arrows):
The code for the bullish and bearish price action in Pine Script is as follows:
// This source code is subject to the terms of the Mozilla Public License 2.0 at https://mozilla.org/MPL/2.0/
// © Sofien-Kaabar

//@version=5
indicator("Bullish & Bearish Price Action", overlay = true)
body_range = math.abs(high - low)
maximum_range = ta.highest(body_range[1], 100)

bullish_signal = body_range[1] > maximum_range[1] and close[1] > open[1]
bearish_signal = body_range[1] > maximum_range[1] and close[1] < open[1]

plotshape(bullish_signal,  style = shape.triangleup,   color = color.green,  location =  location.belowbar, size = size.small)
plotshape(bearish_signal,  style = shape.triangledown, color = color.red,    location =  location.abovebar, size = size.small)
It is important to understand that this technique is not a valid one and does not rely on any empirical results. It’s simply the conclusion of a few old beliefs. Here’s the full picture of the signals:
You can also check out my other newsletter The Weekly Market Analysis Report that sends tactical directional views every weekend to highlight the important trading opportunities using technical analysis that stem from modern indicators. The newsletter is free.
If you liked this article, do not hesitate to like and comment, to further the discussion!


