Bollinger Bands & The RSI — Consider This Simple Trading Strategy
Creating a Trading Strategy Based on the RSI and Bollinger Bands
Technical combinations in trading enable us to generate new and promising signals to help the overal framework. This article shows how to easily combine signals from the RSI and Bollinger Bands into powerful reversal tools.
Quick Refresher on the RSI and the Bollinger Bands
The relative strength index (RSI) is a momentum indicator used in technical analysis to assess whether a stock or other asset is overbought or oversold. It’s measured on a scale from 0 to 100, where readings above 70 indicate overbought conditions, and readings below 30 suggest oversold conditions. RSI helps traders identify potential reversal points in the market.
Typically, we generate bullish signals when the RSI goes out of the 30 zone as we assume that a recovery has started. In contrast, we generate bearish signals when the RSI goes out of the 70 zone as we assume that a correction has started.
Now, let’s talk about Bollinger Bands. They consist of a middle band, which is typically a simple moving average, and two outer bands that are standard deviations away from the middle band. These bands dynamically adjust to market volatility. When prices are more volatile, the bands widen, and when they are less volatile, the bands contract.
Typically, we generate bullish signals when the market re-integrates the lower band as we assume that a recovery has started. In contrast, we generate bearish signals when the market re-integrates the upper band as we assume that a correction has started.
Let’s see now how to combine them in a simple but efficient way.
Creating and Coding the Strategy
The strategy is simple and uses the re-integration (or conservative method) on both indicators. The conditions are as follows:
A bullish signal is generated whenever the RSI surpasses 30 after having been below it while simultaneously, the market surpasses the lower band after having been below it.
A bearish signal is generated whenever the RSI breaks 70 after having been above it while simultaneously, the market breaks the upper band after having been above it.
The following chart shows an example of a generated bearish signal.
Let’s zoom out and check the frequency and quality of signals on the next chart.
It seems that with stable markets (not severely trending), this strategy shows good signals (but this needs to be back-tested of course).
Use the following Pine Script code to show the signals on TradingView:
// This Pine Script™ code is subject to the terms of the Mozilla Public License 2.0 at https://mozilla.org/MPL/2.0/
// © Sofien-Kaabar

//@version=5
indicator("RSI-BB Technique", overlay = true)
Length_RSI = input(defval = 14, title = 'Lookback RSI')
Length_BB = input(defval = 20, title = 'Lookback Bollinger Bands')
rsi = ta.rsi(close, Length_RSI)
ma = ta.sma(close, Length_BB)
std = ta.stdev(close, Length_BB)
upper = ma + (2 * std)
lower = ma - (2 * std)
// Generating signals
bullish_signal = rsi > 30 and rsi[1] < 30 and close > lower and close[1] < lower
bearish_signal = rsi < 70 and rsi[1] > 70 and close < upper and close[1] > upper
// Plotting signals
plotshape(bullish_signal,  style = shape.triangleup,   color = color.blue,   location =  location.belowbar, size = size.small)
plotshape(bearish_signal,  style = shape.triangledown, color = color.orange, location =  location.abovebar, size = size.small)
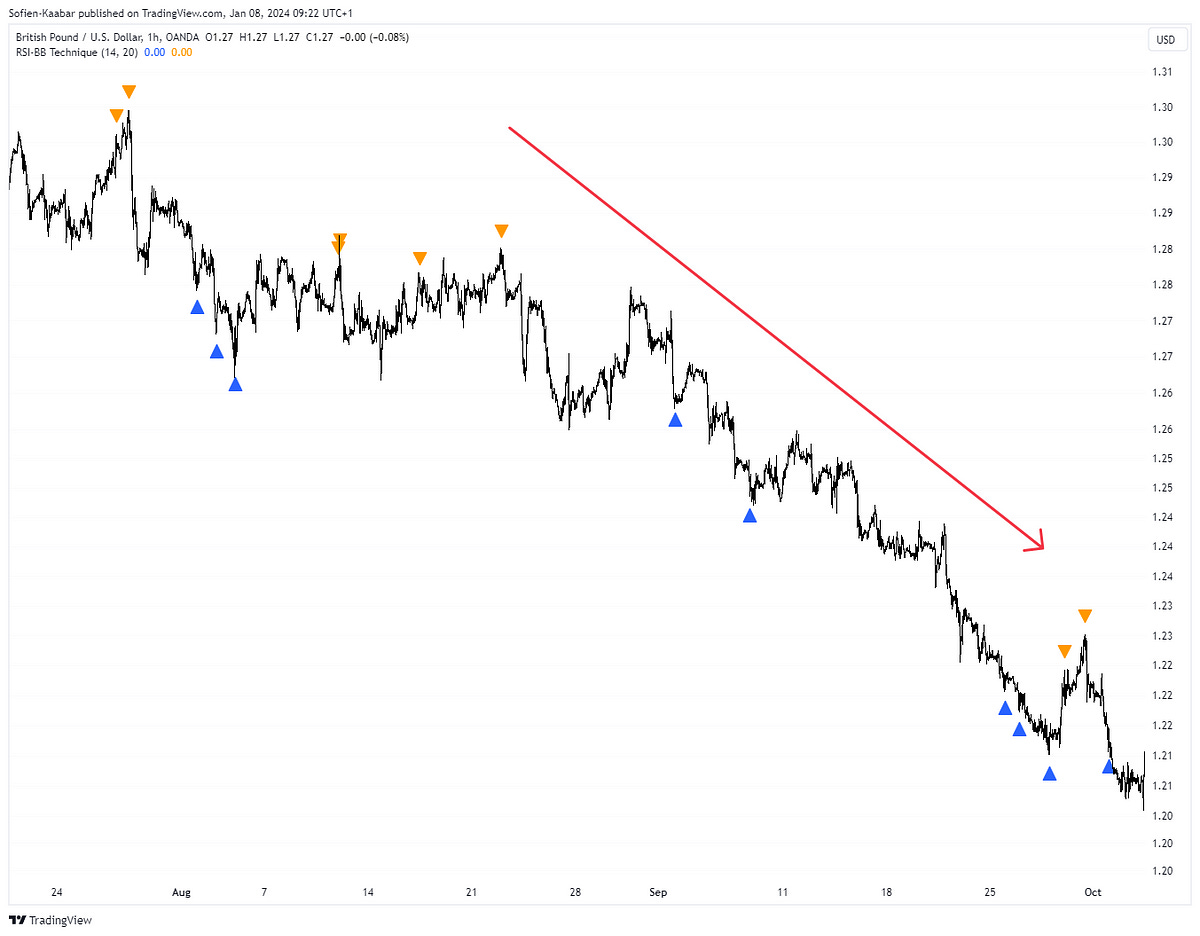
With trending markets, it may be better to consider only the signals that are in the direction of the trend.
For example, only take the bullish signals here:
And only take bearish signals here:
To sum up, combining these both powerful indicators may yield superior signals. Add to this the trend variable which has the potential to improve the signals and you get a basic template of a powerful strategy. Remember risk management, position management, and of course, back-testing with different parameters.
You can also check out my other newsletter The Weekly Market Sentiment Report that sends weekly directional views every weekend to highlight the important trading opportunities using a mix between sentiment analysis (COT report, put-call ratio, etc.) and rules-based technical analysis.
If you liked this article, do not hesitate to like and comment, to further the discussion!


