Beyond the Basics: Advanced Techniques for Technical Indicators
Applying Innovative Concepts to Real-World Trading
Classic technical indicators have been around for decades. They are used through a set of specific rules. But, what we try to change these rules and add some of ours? This article shows a new way to use the relative strength index (RSI). Additionally, you will see how to code and visualize the technique which is called the extreme duration technique.
The Relative Strength Index (RSI)
The RSI is a momentum oscillator that measures the speed and change of price movements. It ranges from 0 to 100 and is typically used to identify overbought or oversold conditions in a market. Follow these algorithmic steps to calculate the RSI:
For each period (e.g., each day if you’re using daily data), calculate the difference between the current and previous closing prices. If the price increased, record the gain. If not, record 0. If the price decreased, record the loss as a positive value. If not, record 0.
Typically, the RSI is calculated over n periods. You calculate the average gain and average loss over this period. Sum the first n periods of gains and divide by n to get the first average gain. Similarly, sum the first n periods of losses and divide by n to get the first average loss.
Use a smoothed moving average for the rest of the averaging. The relative strength (RS) is therefore ratio of the average gain to the average loss:
Finally, calculate the RSI using the RS:
Generally, the RSI has what is known as an oversold and an overbought level. Here’s how to interpret them:
The oversold level is around 30 and is correlated with market bounces.
The overbought level is around 70 and is correlated with market corrections.
Reaching any of these levels will give a contrarian bias. This is known as the aggressive technique.
In contrast, the conservative technique is different, and is the basis of the technique discussed in this article, the extreme duration technique.
The Extreme Duration Technique
The conservative technique, as opposed to the aggressive technique, awaits the exit from the oversold and overbought levels to confirm the signal. Therefore, the conservative technique has the following conditions:
A bullish signal is generated whenever the RSI surpasses 30 area after having been below it.
A bearish signal is generated whenever the RSI breaks 70 area after having been above it.
The extreme duration technique is merely an evolution of the latter. It has the following conditions:
A bullish signal is generated whenever the 8-period RSI surpasses 35 while not surpassing 50. The previous 7 RSI readings must be below 35. The next low must reach the current open price for the signal to be valid.
A bearish signal is generated whenever the 8-period RSI breaks 65 while not breaking 50. The previous 7 RSI readings must be above 65. The next high must reach the current open price for the signal to be valid.
Use the following code in PineScript (TradingView’s language) to get the technique:
// This source code is subject to the terms of the Mozilla Public License 2.0 at https://mozilla.org/MPL/2.0/
// © Sofien-Kaabar

//@version=5
indicator('Extreme Duration Technique', overlay = true)

upper_barrier = input(defval = 65, title = 'Upper Barrier')
lower_barrier = input(defval = 35, title = 'Lower Barrier')
length = input(defval = 8, title = 'Lookback')

rsi = ta.rsi(close, length)

buy  = low  < open[1] and rsi[1]  < 50 and rsi[1] > lower_barrier  and rsi[2] < lower_barrier and rsi[3] < lower_barrier and rsi[4] < lower_barrier and rsi[5] < lower_barrier and rsi[6] < lower_barrier and rsi[7] < lower_barrier and rsi[8] < lower_barrier
sell = high > open[1] and rsi[1]  > 50 and rsi[1] < upper_barrier  and rsi[2] > upper_barrier and rsi[3] > upper_barrier and rsi[4] > upper_barrier and rsi[5] > upper_barrier and rsi[6] > upper_barrier and rsi[7] > upper_barrier and rsi[8] > upper_barrier

plotshape(buy,  style = shape.triangleup, color = color.green, location =  location.belowbar, size = size.small)
plotshape(sell,  style = shape.triangledown, color = color.red, location =  location.abovebar, size = size.small)

if (buy)
    line.new(x1 = bar_index, y1 = open[1], x2 = bar_index + 10, y2 = open[1], color = color.green, width = 3)
if (sell)
    line.new(x1 = bar_index, y1 = open[1], x2 = bar_index + 10, y2 = open[1], color = color.red, width = 3)
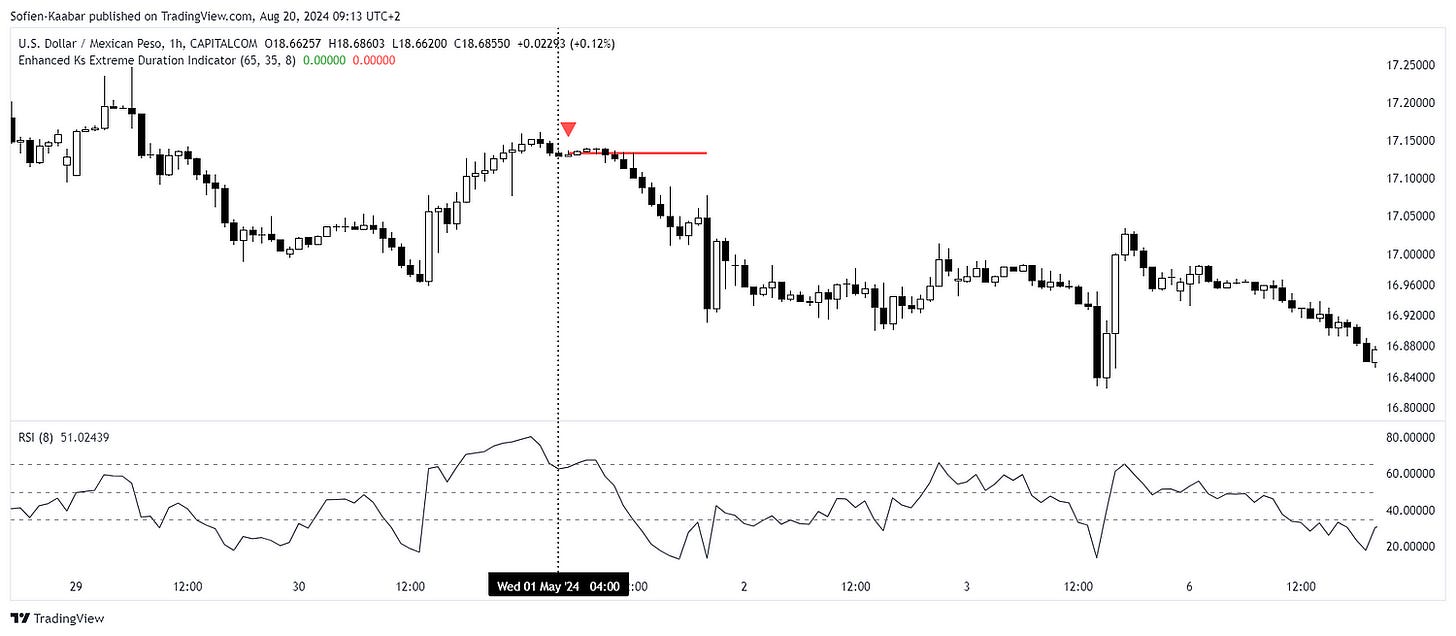
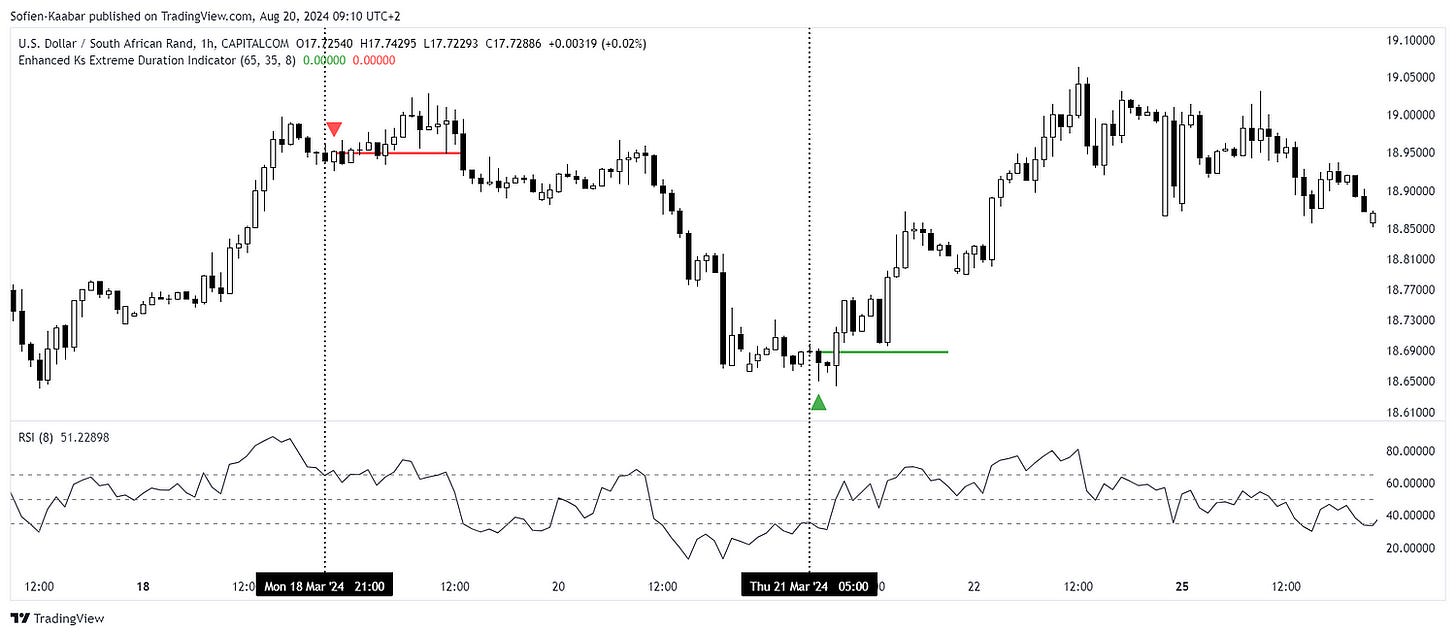
The following chart shows a few signals generated by the extreme duration technique.
The technique is best used during a sideways market. Trending markets make it hard to have convictions in the signals.
Make sure to back-test every market and every strategy before putting it to use.
You can also check out my newsletter The Weekly Market Sentiment Report that sends weekly directional views every weekend to highlight the important trading opportunities using a mix between sentiment analysis (COT report, put-call ratio, etc.) and rules-based technical analysis.
If you liked this article, do not hesitate to like and comment, to further the discussion!


