
An Innovative Way to Find Support and Resistance Levels
New Horizons on Finding Support & Resistance Levels


Finding objective support and resistance lines can be tricky but not impossible. This article presents a new innovative way of finding quality levels that can be used as triggers to confirm our biases.
Start your Free Trial now at O’Reilly and start reading the Early Release of my upcoming book “Mastering Financial Pattern Recognition” which covers everything you need to know about candlestick patterns and how to code them in Python! (Bonus points: You will discover new never-seen-before patterns). You will also find technical indicators, risk management, and even behavioral finance covered in the book!
Mastering Financial Pattern Recognition
Candlesticks have become a key component of platforms and charting programs for financial trading. With these charts…www.oreilly.com
Introduction to Support and Resistance Levels
At its purest form, a support level is an area supposed to keep prices from going down further. Naturally, when the market price approaches a support area, the right decision is to have a bullish bias.

A resistance level is an area supposed to keep prices from going up further. Naturally, when the market price approaches a resistance area, the right decision is to have a bearish bias. The above chart shows the support line in green and the resistance line in blue drawn subjectively based on empirical observation. It is known that finding support and resistance levels can be done in many ways:
Charting: This technique is mostly subjective and uses past reactions as pinpoints for the future. We can draw ascending or descending trend lines as well as horizontal support and resistance levels. The flaw of this technique is that it can be very subjective and can differ from one trader to another.
Fibonacci: This technique is less subjective and uses the Fibonacci sequence (discussed in previous articles) as retracements to find reactionary levels.
Moving Averages: This technique is objective and uses moving averages as dynamic support and resistance levels to follow market reactions. The flaw of this technique is that there is a huge number of periods and types of moving averages to choose from where the reliability differs.
Pivot Points: This technique is objective and uses an old method of calculating the future implied support and resistance lines. It has stood the test of time and continues to be an efficient and quick way of analyzing the market.
Make sure to focus on the concepts and not the code. You can find the codes of most of my strategies in my books. The most important thing is to comprehend the techniques and strategies.
Knowledge must be accessible to everyone. This is why, from now on, a purchase of either one of my new books “Contrarian Trading Strategies in Python” or “Trend Following Strategies in Python” comes with free PDF copies of my first three books (Therefore, purchasing one of the new books gets you 4 books in total). The two new books listed above feature a lot of advanced indicators and strategies with a GitHub page. You can use the below link to purchase one of the two books (Please specify which one and make sure to include your e-mail in the note).
Pay Kaabar using PayPal.Me
Go to paypal.me/sofienkaabar and type in the amount. Since it’s PayPal, it’s easy and secure. Don’t have a PayPal…www.paypal.com
Creating the K’s Objective Support & Resistance Lines
Objectively, it can be hard to find support and resistance zones. Sometimes, we use pivot points for this or moving averages but we can also use this new technique which relies on the range technique. The idea is that we can find support at around a certain threshold of a past range. Here are the steps needed to create K’s objective support and resistance lines:
Calculate the difference between the maximum of the highs and the minimum of the lows of a pre-determined lookback period in the past. This will give us the maximum range.
Calculate the support level as a certain percentage of the range measured previously.
Calculate the resistance level as a certain percentage of the range measured previously.
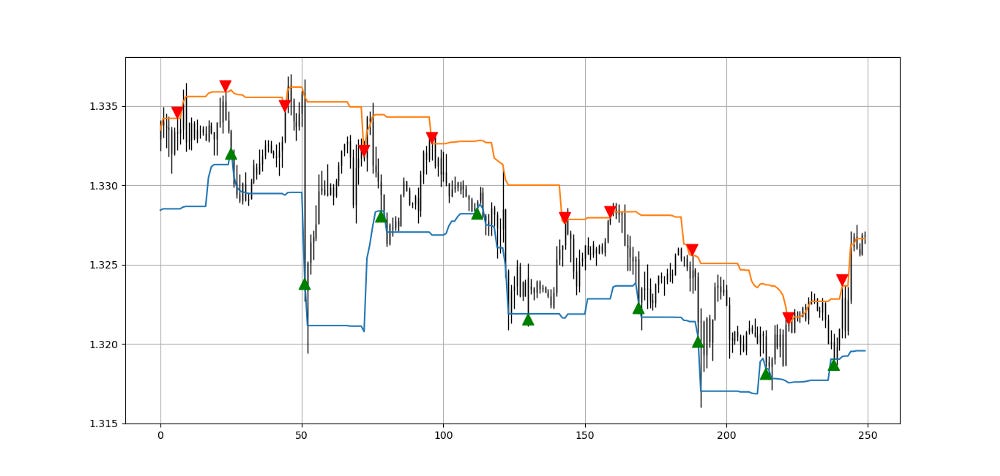
Let us take an example of a 0.125 maximum range on the EURUSD. The current support is found by adding the minimum lows in the maximum range calculation to 0.125 multiplied by 0.10. The current resistance is found by adding the maximum highs in the maximum range calculation to 0.125 multiplied by 0.90.

def adder(data, times):

    for i in range(1, times + 1):

        new = np.zeros((len(data), 1), dtype = float)

        data = np.append(data, new, axis = 1)
return datadef deleter(data, index, times):
for i in range(1, times + 1):
data = np.delete(data, index, axis = 1)return data
def jump(data, jump):
data = data[jump:, ]
return datadef k_support_resistance_levels(data, lookback, lower_extreme, upper_extreme, high, low, close, where):
# adding a few columns
data = adder(data, 5)
# maximum range calculation
for i in range(len(data)):
try:
data[i, where] = max(data[i - lookback + 1:i + 1, high]) - min(data[i - lookback + 1:i + 1, low])
except ValueError:
pass
# support and resistance levels
for i in range(len(data)):
try:
data[i, where + 1] = min(data[i - lookback + 1:i + 1, low]) + (data[i, where] * lower_extreme)
data[i, where + 2] = min(data[i - lookback + 1:i + 1, low]) + (data[i, where] * upper_extreme)except ValueError:
pass
return dataWe assume that the market should bounce whenever it reaches the support level and pause whenever it reaches the resistance level.
A long (Buy) signal is generated whenever the market reaches the support level.
A short (Sell) signal is generated whenever the market reaches the resistance level.
def signal(data, high_price, low_price, support_level, resistance_level, buy_column, sell_column):

    data = adder(data, 5)

    for i in range(len(data)):

        if data[i, low_price] <= data[i, support_level] and \
           data[i - 1, low_price] > data[i - 1, support_level] and \
           data[i - 2, low_price] > data[i - 2, support_level]:

            data[i, buy_column] = 1

        elif data[i, high_price] >= data[i, resistance_level] and \
             data[i - 1, high_price] < data[i - 1, resistance_level] and \
             data[i - 2, high_price] < data[i - 2, resistance_level]:

            data[i, sell_column] = -1

    return data
If you want to see how to create all sorts of algorithms yourself, feel free to check out Lumiwealth. From algorithmic trading to blockchain and machine learning, they have hands-on detailed courses that I highly recommend.
Learn Algorithmic Trading with Python Lumiwealth
Learn how to create your own trading algorithms for stocks, options, crypto and more from the experts at Lumiwealth. Click to learn more
Summary
To sum up, what I am trying to do is to simply contribute to the world of objective technical analysis which is promoting more transparent techniques and strategies that need to be back-tested before being implemented. This way, technical analysis will get rid of the bad reputation of being subjective and scientifically unfounded.
I recommend you always follow the the below steps whenever you come across a trading technique or strategy:
Have a critical mindset and get rid of any emotions.
Back-test it using real life simulation and conditions.
If you find potential, try optimizing it and running a forward test.
Always include transaction costs and any slippage simulation in your tests.
Always include risk management and position sizing in your tests.
Finally, even after making sure of the above, stay careful and monitor the strategy because market dynamics may shift and make the strategy unprofitable.