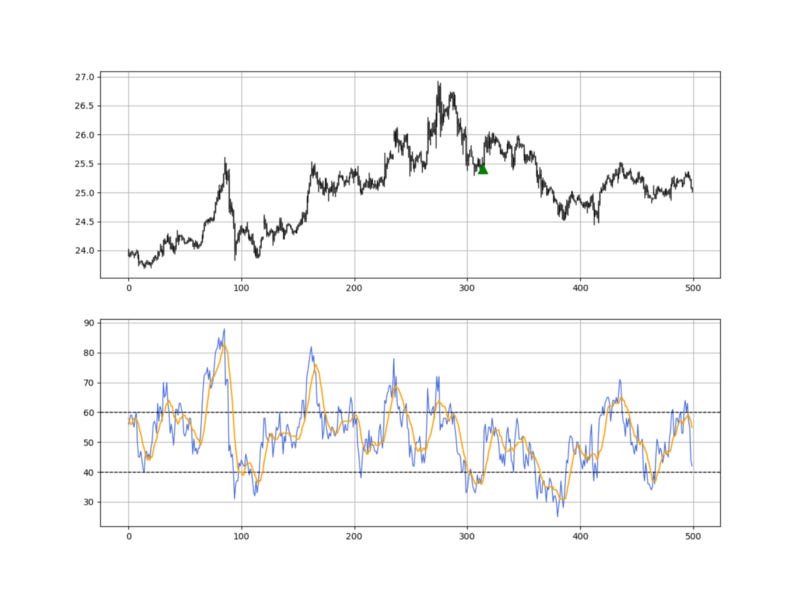
Pull-back trading techniques are very valuable and heavily used. This article presents a pull-back technique with special conditions.
The Pull-Back Technique
The pull-back method is a known technique in the world of trading, it is based on the fact that after a breakout (bullish or bearish), the market will stabilize before continuing the initial move due to profit-taking and increased orders. This generally provides a good entry level for the trades in the right direction. Below is an illustration of a pull-back.
Another example can be an exit of a triangular configuration such as the below. The market has broken its descending support outlined with the green upwards pointing arrows, then tried coming back but found resistance at the same descending support line which is now resistance, to finally continue the drop.
The idea of the strategy is to apply this method on the RSI and its moving average. Therefore, the equivalent of price in the strategy is the RSI and the equivalent of support/resistance lines is the moving average.
The Relative Strength Index
First introduced by J. Welles Wilder Jr., the RSI is one of the most popular and versatile technical indicators. Mainly used as a contrarian indicator where extreme values signal a reaction that can be exploited. Typically, we use the following steps to calculate the default RSI:
Calculate the change in the closing prices from the previous ones.
Separate the positive net changes from the negative net changes.
Calculate a smoothed moving average on the positive net changes and on the absolute values of the negative net changes.
Divide the smoothed positive changes by the smoothed negative changes. We will refer to this calculation as the Relative Strength — RS.
Apply the normalization formula shown below for every time step to get the RSI.
The above chart shows the hourly values of the GBPUSD in black with the 13-period RSI. We can generally note that the RSI tends to bounce close to 25 while it tends to pause around 75. To code the RSI in Python, we need an OHLC array composed of four columns that cover open, high, low, and close prices.
def adder(data, times):

    for i in range(1, times + 1):

        new = np.zeros((len(data), 1), dtype = float)

        data = np.append(data, new, axis = 1)
return datadef deleter(data, index, times):
for i in range(1, times + 1):
data = np.delete(data, index, axis = 1) return data
def jump(data, jump):
data = data[jump:, ]
return datadef ma(data, lookback, close, where):
data = adder(data, 1)
for i in range(len(data)):
try:
data[i, where] = (data[i - lookback + 1:i + 1, close].mean())
except IndexError:
pass
data = jump(data, lookback)
return datadef ema(data, alpha, lookback, what, where):
alpha = alpha / (lookback + 1.0)
beta = 1 - alpha
data = ma(data, lookback, what, where) data[lookback + 1, where] = (data[lookback + 1, what] * alpha) + (data[lookback, where] * beta) for i in range(lookback + 2, len(data)):
try:
data[i, where] = (data[i, what] * alpha) + (data[i - 1, where] * beta)
except IndexError:
pass
return datadef rsi(data, lookback, close, where):
data = adder(data, 5)
for i in range(len(data)):
data[i, where] = data[i, close] - data[i - 1, close]
for i in range(len(data)):
if data[i, where] > 0:
data[i, where + 1] = data[i, where]
elif data[i, where] < 0:
data[i, where + 2] = abs(data[i, where])
lookback = (lookback * 2) - 1 # From exponential to smoothed
data = ema(data, 2, lookback, where + 1, where + 3)
data = ema(data, 2, lookback, where + 2, where + 4) data[:, where + 5] = data[:, where + 3] / data[:, where + 4]
data[:, where + 6] = (100 - (100 / (1 + data[:, where + 5]))) data = deleter(data, where, 6)
data = jump(data, lookback) return dataCoding the Strategy
To code the strategy, you need to understand the trading conditions first:
A long signal is generated whenever the 14-period RSI surpasses its 9-period moving average, then comes back to it and shapes an upside reaction from it. The signal is given after the RSI recognizes its moving average. All of this must happen while the RSI is below 50.
A short signal is generated whenever the 14-period RSI breaks its 9-period moving average, then comes back to it and shapes a downside reaction from it. The signal is given after the RSI recognizes its moving average. All of this must happen while the RSI is above 50.
Make sure to focus on the concepts and not the code. You can find the codes of most of my strategies in my books. The most important thing is to comprehend the techniques and strategies.
The signal function required to have the above conditions is as follows:
def signal(data, rsi_column, ma_column, buy, sell):

    data = add_column(data, 10)

    for i in range(len(data)):

        try:

            if data[i, rsi_column] > data[i, ma_column] and
               data[i, rsi_column] < 50 and
               data[i - 1, rsi_column] == data[i - 1, ma_column] and
               data[i - 2, rsi_column] > data[i - 1, rsi_column] and
               data[i - 3, rsi_column] < data[i - 3, ma_column]:

                   data[i + 1, buy] = 1
elif data[i, rsi_column] < data[i, ma_column] and \
data[i, rsi_column] > 50 and \
data[i - 1, rsi_column] == data[i - 1, ma_column] and
data[i - 2, rsi_column] < data[i - 1, rsi_column] and
data[i - 3, rsi_column] > data[i - 3, ma_column]:
data[i + 1, sell] = -1
except IndexError:
pass
return data


