Advanced Pattern Recognition For Trading
Creating a Pattern Recognition Trading Strategy in TradingView
Pattern recognition is always an exciting field when it comes to financial research and trading. This article discusses a patterns-based strategy applied on a famous technical indicator.
The 8–3 Pattern
Pattern can come in all shapes in forms, from price patterns to volume patterns and even timing patterns. The 8–3 is a simple pattern that relies on successive conditions on different variables to be realized. The following are the conditions for the 8–3 pattern:
A buy pattern occurs after eight successive close prices where each close price is lower than the close price three periods ago.
A sell pattern occurs after eight successive close prices where each close price is higher than the close price three periods ago.
The strategy takes the 8–3 a bit further and applies the conditions on the RSI with an extra step.
You can also check out my other newsletter The Weekly Market Sentiment Report that sends tactical directional views every weekend to highlight the important trading opportunities using a mix between sentiment analysis (COT reports, Put-Call ratio, Gamma exposure index, etc.) and technical analysis.
Creating and Coding the Strategy
The strategy has the following rules:
For a long signal, the RSI must shape a 8–3 pattern with the last value below 30.
For a short signal, the RSI must shape a 8–3 pattern with the last value above 70.
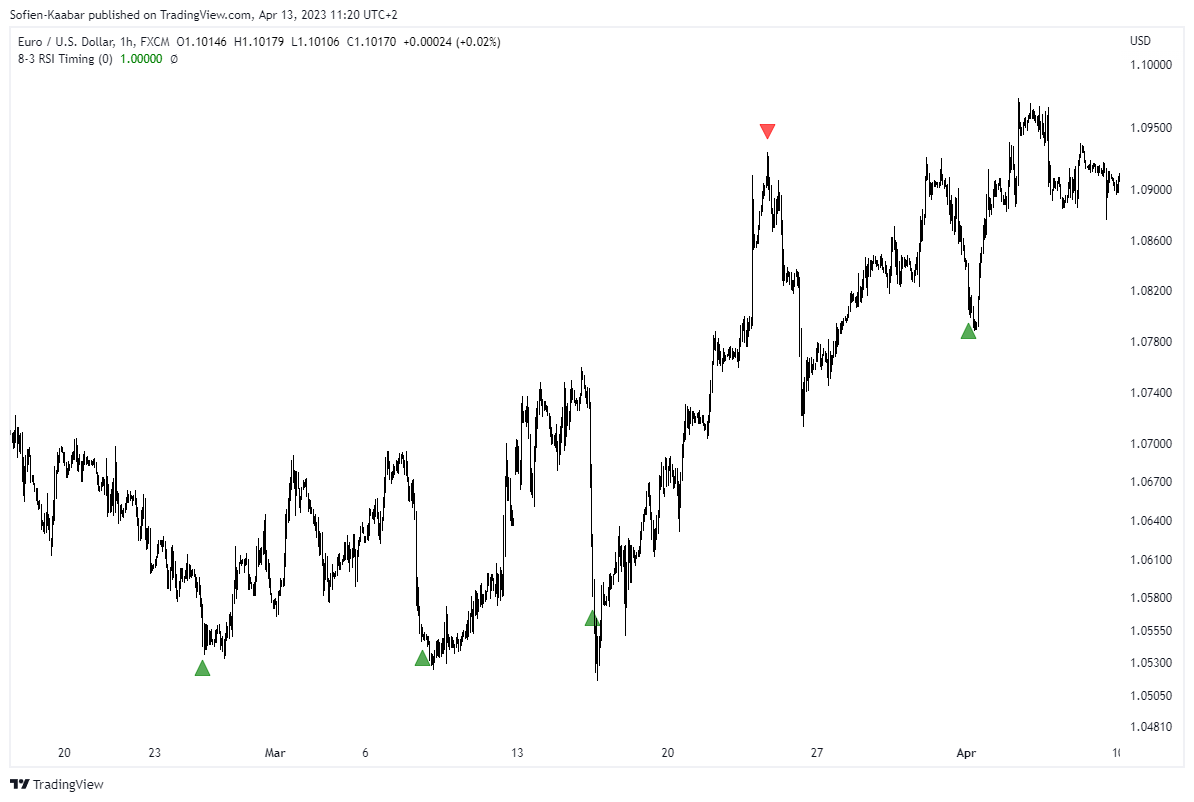
The following Figure shows the signal chart on EURUSD:
The code of the startegy on TradingView is as follows:
study("8-3 RSI Pattern", overlay = true)

transp   = input(0)
Numbers  = input(true)
SR       = input(true)
Barcolor = input(true)

TD = rsi(close, 14) > rsi(close, 14)[3] ?nz(TD[1])+1:0
TS = rsi(close, 14) < rsi(close, 14)[3] ?nz(TS[1])+1:0

TDUp = TD - valuewhen(TD < TD[1], TD , 1 )
TDDn = TS - valuewhen(TS < TS[1], TS , 1 )

plotshape(TDDn==8 and rsi(close, 14) < 30?true:na, style = shape.triangleup,   color = green, location =  location.belowbar, size = size.small)
plotshape(TDUp==8 and rsi(close, 14) > 70?true:na, style = shape.triangledown, color = red,   location =  location.abovebar, size = size.small)
The following Figure shows the signal chart on DXY:
You can also check out my other newsletter The Weekly Market Analysis Report that sends tactical directional views every weekend to highlight the important trading opportunities using technical analysis that stem from modern indicators. The newsletter is free.
If you liked this article, do not hesitate to like and comment, to further the discussion!


