A Trend-Following Strategy With Psychological Levels.
Combining Moving Averages & Psychological Levels.

Combining strategies and indicators is always the right path towards a robust technical or quantitative trading system. In this article, the quest continues towards combining different elements in the hope of finding a reliable system. We will code and discuss moving averages and the concept of psychological levels and then combine them together to form interesting signals.
I have just released a new book after the success of the previous book. It features advanced trend following indicators and strategies with a GitHub page dedicated to the continuously updated code. Also, this book features the original colors after having optimized for printing costs. If you feel that this interests you, feel free to visit the below Amazon link, or if you prefer to buy the PDF version, you could contact me on LinkedIn.
Moving Averages
Moving averages help us confirm and ride the trend. They are the most known technical indicator and this is because of their simplicity and their proven track record of adding value to the analyses. We can use them to find support and resistance levels, stops and targets, and to understand the underlying trend. This versatility makes them an indispensable tool in our trading arsenal.

As the name suggests, this is your plain simple mean that is used everywhere in statistics and basically any other part in our lives. It is simply the total values of the observations divided by the number of observations. Mathematically speaking, it can be written down as:

To code the simple moving average, we can follow this syntax in Python while making sure we have defined the primal manipulation functions also seen below:
# The function to add a certain number of columns
def adder(Data, times):

    for i in range(1, times + 1):

        z = np.zeros((len(Data), 1), dtype = float)
        Data = np.append(Data, z, axis = 1)
return Data# The function to deleter a certain number of columns
def deleter(Data, index, times):
for i in range(1, times + 1):
Data = np.delete(Data, index, axis = 1) return Data# The function to delete a certain number of rows from the beginning
def jump(Data, jump):
Data = Data[jump:, ]
return Datadef ma(Data, lookback, close, where): Data = adder(Data, 1) for i in range(len(Data)): try:
Data[i, where] = (Data[i - lookback + 1:i + 1, close].mean())
except IndexError:
pass
# Cleaning
Data = jump(Data, lookback) return DataAnother even more dynamic moving average is the exponential one. Its idea is to give more weight to the more recent values so that it reduces the lag between the price and the average.

Notice how the exponential moving average is closer to prices than the simple one when the trend is strong. This is because it gives more weight to the latest values so that the average does not stay very far. To code a function in Python that outputs this type of average, you can use the below snippet:
def ema(Data, alpha, lookback, what, where):

    alpha = alpha / (lookback + 1.0)
    beta  = 1 - alpha

    # First value is a simple SMA
    Data = ma(Data, lookback, what, where)

    # Calculating first EMA
    Data[lookback + 1, where] = (Data[lookback + 1, what] * alpha) + (Data[lookback, where] * beta)
# Calculating the rest of EMA
for i in range(lookback + 2, len(Data)):
try:
Data[i, where] = (Data[i, what] * alpha) + (Data[i - 1, where] * beta)
except IndexError:
pass
return DataThe Concept of Psychological Levels
Psychological levels form an important part in any analysis. The reason for this is because mentally, they are given more attention than other levels. For instance, which price would you retain more in your mind if you come across it? 1.1500 on the EURUSD or 1.3279 on the GBPUSD? By Psychological Levels, we are talking about either round numbers (such as 1.2000 on the EURUSD) or simply par numbers (such as 1.000 USDCHF or $100 on Apple stock).
Clearly, round numbers are the first part of a psychological price. The other part is simply significance. For example, the par-value or par-level such as 1.000 on the USDCHF or 100.00 on the USDJPY is considered a par-level. The basic idea is that around these levels, market participants may choose to place their orders, hence, a form of reaction may happen.

Our aim is to develop an algorithm that trades whenever the market reaches a psychological level. This is done using a very simple loop function in Python discussed later.
def psychological_levels_scanner(data, close, where):

    # Adding buy and sell columns
    data = adder(data, 10)

    # Rounding for ease of use
    data = rounding(data, 4)

    # Threshold
    level     = 0

    # Scanning for Psychological Levels
    for i in range(len(data)):

        for i in range(len(data)):

            if data[i, close] == level:

                data[i, where] = 1

        level = round(level + 0.01, 2)
        if level > 5:
            break

    return data
Obviously the above code can use some better way to define a psychological level such as modulo technique, division by 5, or a search for values where the last two digits is double zero. However, the idea is to show that even with simplistic syntax, we can arrive at what we are trying to do.

The above plot shows also the signal chart on the USDCHF H3 values. We can notice that the signals tend to be good on average due to them occurring around key reversal points. This is of course not sustainable nor is it profitable on its own but value-wise, it is definitely an addition.
If you are also interested by more technical indicators and strategies, then my book might interest you:
Creating the Signals
As with any proper research method, the aim is to test the strategy and to be able to see for ourselves whether it is worth having as an add-on to our pre-existing trading framework or not.
The first step is creating the trading rules. When will the system buy and when will it go short? In other words, when is the signal given that tells the system that the current market will go up or down?
The trading conditions we can choose are:
Go long (Buy) whenever the market is above its short-term moving average and a psychological level has been seen, i.e. the market closed at a round level.
Go short (Sell) whenever the market is below its short-term moving average and a psychological level has been seen, i.e. the market closed at a round level.

The above chart shows the signals generated from the system. We have to keep in mind the frequency of the signals when we are developing a trading algorithm. The signal function used to generate the triggers based on the conditions mentioned above can be found in this snippet:
def signal(Data, ma_column, psychological_level_column, buy, sell):

    Data = adder(Data, 20)

    for i in range(len(Data)):

        if Data[i, 3] > Data[i, ma_column] and Data[i, psychological_level_column] == 1 and abs(Data[i, 3] - Data[i, ma_column]) < 0.0010:
            Data[i, buy] = 1

        elif Data[i, 3] < Data[i, ma_column] and Data[i, psychological_level_column] == 1 and abs(Data[i, 3] - Data[i, ma_column]) < 0.0010:
            Data[i, sell] = -1

    return Data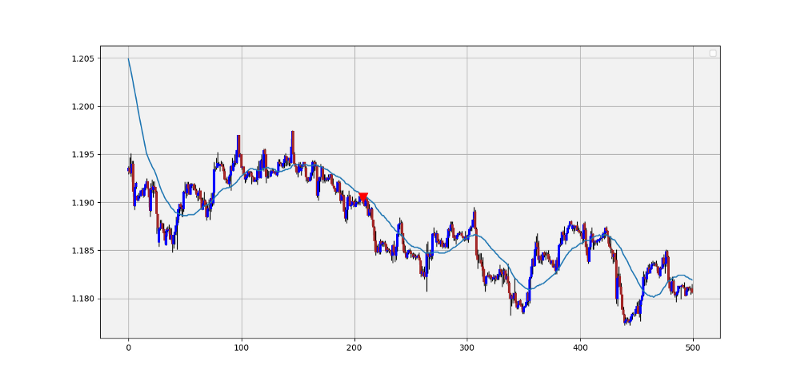
Now, it is time to see the intuition of analyzing the strategy. Remember, no Back-testing results will be delivered anymore but the below will be much more helpful.

Remember to always do your back-tests. You should always believe that other people are wrong. My indicators and style of trading may work for me but maybe not for you.
I am a firm believer of not spoon-feeding. I have learnt by doing and not by copying. You should get the idea, the function, the intuition, the conditions of the strategy, and then elaborate (an even better) one yourself so that you back-test and improve it before deciding to take it live or to eliminate it. My choice of not providing specific Back-testing results should lead the reader to explore more herself the strategy and work on it more.
One Last Word
I have recently started an NFT collection that aims to support different humanitarian and medical causes. The Society of Light is a set of limited collectibles which will help make the world slightly better as each sale will see a percentage of it sent directly to the charity attributed to the avatar. As I always say, nothing better than a bullet list to outline the benefits of buying these NFT’s:
High-potential gain: By concentrating the remaining sales proceedings on marketing and promoting The Society of Light, I am aiming to maximize their value as much as possible in the secondary market. Remember that trading in the secondary market also means that a portion of royalties will be donated to the same charity.
Art collection and portfolio diversification: Having a collection of avatars that symbolize good deeds is truly satisfying. Investing does not need to only have selfish needs even though there is nothing wrong with investing to make money. But what about investing to make money, help others, and collect art?
Donating to your preferred cause(s): This is a flexible way of allocating different funds to your charities.
A free copy of my book in PDF: Any buyer of any NFT will receive a free copy of my latest book shown in the link of the article.