


A Step-by-Step Guide Towards a Trend-Following Trading Strategy
Creating and Coding a Trend-Following Trading Strategy From Scratch


Trend-following strategies are concerned with time in the market rather than market timing and they seek to find stable environements so that a position in the way of the trend becomes profitable as the market continues. In this article, the strategy discussed is a simple indicator created to measure the trend’s intensity.
The Concept of Moving Averages
Moving averages help us confirm and ride the trend. They are the most known technical indicator and this is because of their simplicity and their proven track record of adding value to the analyses. We can use them to find support and resistance levels, stops and targets, and to understand the underlying trend. This versatility makes them an indispensable tool in our trading arsenal.
As the name suggests, this is your plain simple mean that is used everywhere in statistics and basically any other part in our lives. It is simply the total values of the observations divided by the number of observations. Mathematically speaking, it can be written down as:

We can see that the moving average is providing decent dynamic support and resistance levels.

The Trend Intensity Indicator
The Trend Intensity Indicator (TII) is a measure of the strength of the trend. It is a relatively simple calculation to make.
The indicator is created by a 60-period moving average and price deviations around it, then, we will count the number of the up periods relative to the total number of periods. Let us build the indicator step-by-step:
Define the lookback period which is set at 60 and calculate the moving average on the market price using this lookback period.
Calculate the deviations of the market price from the moving average.
Now, we want to count the values where the market was above its 60-period moving average and where it was below it.
And finally, we can calculate the TII using the below formula:

Here’s a great code from Alex Orekhov to code the TII on TradingView:
 //@version=3
// Copyright (c) 2018-present, Alex Orekhov (everget)
// Trend Intensity Index script may be freely distributed under the MIT license.
study("Trend Intensity Index", shorttitle="TII")

majorLength = input(title="Major Length", type=integer, defval=60)
minorLength = input(title="Minor Length", type=integer, defval=30)
upperLevel = input(title="Upper Level", type=integer, defval=80)
lowerLevel = input(title="Lower Level", type=integer, defval=20)
highlightBreakouts = input(title="Highlight Overbought/Oversold Breakouts ?", type=bool, defval=true)
src = input(title="Source", type=source, defval=close)

sma = sma(src, majorLength)

positiveSum = 0.0
negativeSum = 0.0

for i = 0 to minorLength - 1
    price = nz(src[i])
    avg = nz(sma[i])
    positiveSum := positiveSum + (price > avg ? price - avg : 0)
    negativeSum := negativeSum + (price > avg ? 0 : avg - price)

tii = 100 * positiveSum / (positiveSum + negativeSum)

tiiColor = tii > upperLevel ? #0ebb23 : tii < lowerLevel ? #ff0000 : #f4b77d
plot(tii, title="TII", linewidth=2, color=tiiColor, transp=0)

transparent = color(white, 100)

maxLevelPlot = hline(100, title="Max Level", linestyle=dotted, color=transparent)
upperLevelPlot = hline(upperLevel, title="Upper Level", linestyle=dotted)
hline(50, title="Middle Level", linestyle=dotted)
lowerLevelPlot = hline(lowerLevel, title="Lower Level", linestyle=dotted)
minLevelPlot = hline(0, title="Min Level", linestyle=dotted, color=transparent)

fill(upperLevelPlot, lowerLevelPlot, color=purple, transp=95)

upperFillColor = tii > upperLevel and highlightBreakouts ? green : transparent
lowerFillColor = tii < lowerLevel and highlightBreakouts ? red : transparent

fill(maxLevelPlot, upperLevelPlot, color=upperFillColor, transp=90)
fill(minLevelPlot, lowerLevelPlot, color=lowerFillColor, transp=90)
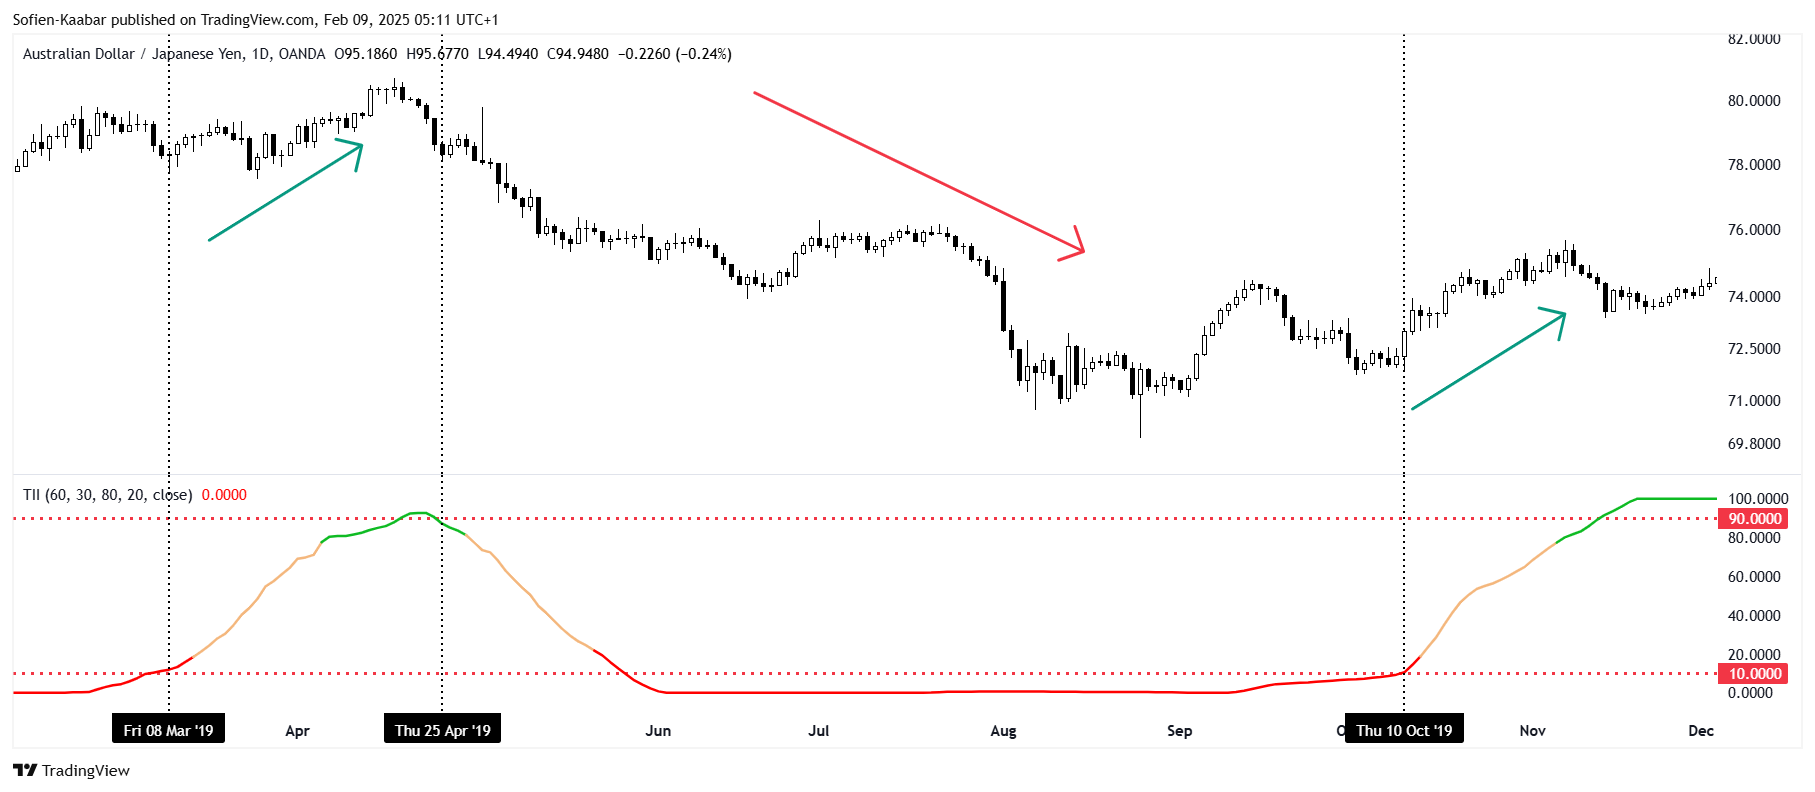
The Strategy
The strategy relies on confirmation where we initiate the trades based on the validtion of the trend. This can be done by considering the following conditions:
Long whenever the TII surpasses 10 with the previous reading being equal to or less than 10. Hold this position until getting a contrarian signal or getting stopped out by the risk management indicator.
Short whenever the TII goes below 90 with the previous reading being equal to or greater than 90. Hold this position until getting a contrarian signal or getting stopped out by the risk management indicator.
Check out my newsletter that sends weekly directional views every weekend to highlight the important trading opportunities using a mix between sentiment analysis (COT report, put-call ratio, etc.) and rules-based technical analysis.
